Narrative over numbers: Andreessen Horowitz's State of Crypto report
Venture capital firm and crypto pusher Andreessen Horowitz wants you to keep buying crypto, and is not above publishing blatant falsehoods to convince you to do so.


Venture capital firm Andreessen Horowitz (aka "a16z") has invested billions in crypto, raising four separate crypto funds: $350 million in 2018, $515 million in 2020, $2.2 billion in 2021, and $4.5 billion in 2022.1 Needless to say, they have a strong incentive to evangelize crypto at all costs, regardless of what's actually happening in the industry.
They spent much of crypto's most recent bull run endlessly talking up crypto, with general partners like Chris Dixon writing long, starry-eyed blog posts about "why web3 matters",2 going on podcasts to preach the gospel,3 and lashing out at critics.4 He did a better job on the podcasts than partner Marc Andreessen or advisor Packy McCormick, but they… well, they tried. A16z launched an entire "web3 with a16z crypto" podcast and "web3 weekly" newsletter, claiming to "cut through all the noise and share the signals that matter", but instead nakedly evangelizing in hopes of luring in the next greater fool.
Crypto's a tougher sell these days. The string of high-profile collapses that made international headlines throughout 2022 are fresh in everyone's minds, NFTs have developed a widespread reputation of being kind of cringe, and when I (rarely) mention blockchains to people in real life, the most common reply I get is, "that's all a scam, right?" After mostly negative price movement, the recoveries over the past few months still leave the Bitcoin price down more than 40% from the beginning of 2022.5 No one seems to be saying "WAGMI" anymore,a and I haven't been told to "have fun staying poor" as a no-coiner in a very long time.6 A lot of the loudest crypto pushers have moved on to greener pastures, rebranding as "AI influencers".
But reading Andreessen Horowitz's newest State of Crypto report, one wonders if they exist in a parallel universe where the recent "crypto winter" never came to pass.
The truth is that Andreessen Horowitz needs crypto to do well. With an asset class so dependent on sentiment for value, they seem to be hoping that if they can convince both their investors and the general public that everything is going just great and crypto prices are about to take off again, they can cause it to become true.
The result of this approach is an incredibly shameless piece of propaganda showing the extents to which Andreessen Horowitz is willing to manipulate facts and outright lie, hoping to turn the sentiment on the crypto industry back to where retail investors were providing substantial pools of liquidity with which they could line their pockets. If anyone still believes that venture capital firms like Andreessen Horowitz are powerful sources of innovation and societal benefit, I hope this will give them pause.
Contents
Background
The report
Behold, the "State of Crypto 2023". The slides I skip can be seen in the full report; I won't reproduce them here simply to avoid making an extremely long article even longer.
But first, a little background.
Audience
Andreessen Horowitz writes in their marketing copy that accompanied the report that "it would be easy for a casual observer to overlook the rapid progress the crypto industry is making", and states that their report seeks to address that, suggesting that their target audience here is the lay public.
This makes sense. Convincing retail investors and members of the general public to buy in to crypto has been the primary goal of the last five or so years in the crypto world, and retail interest has proven extremely lucrative for venture capital firms like Andreessen Horowitz.
They of course include a cover-your-ass slide of small-print disclosures. It's the very last slide, and you have to squint to read it:
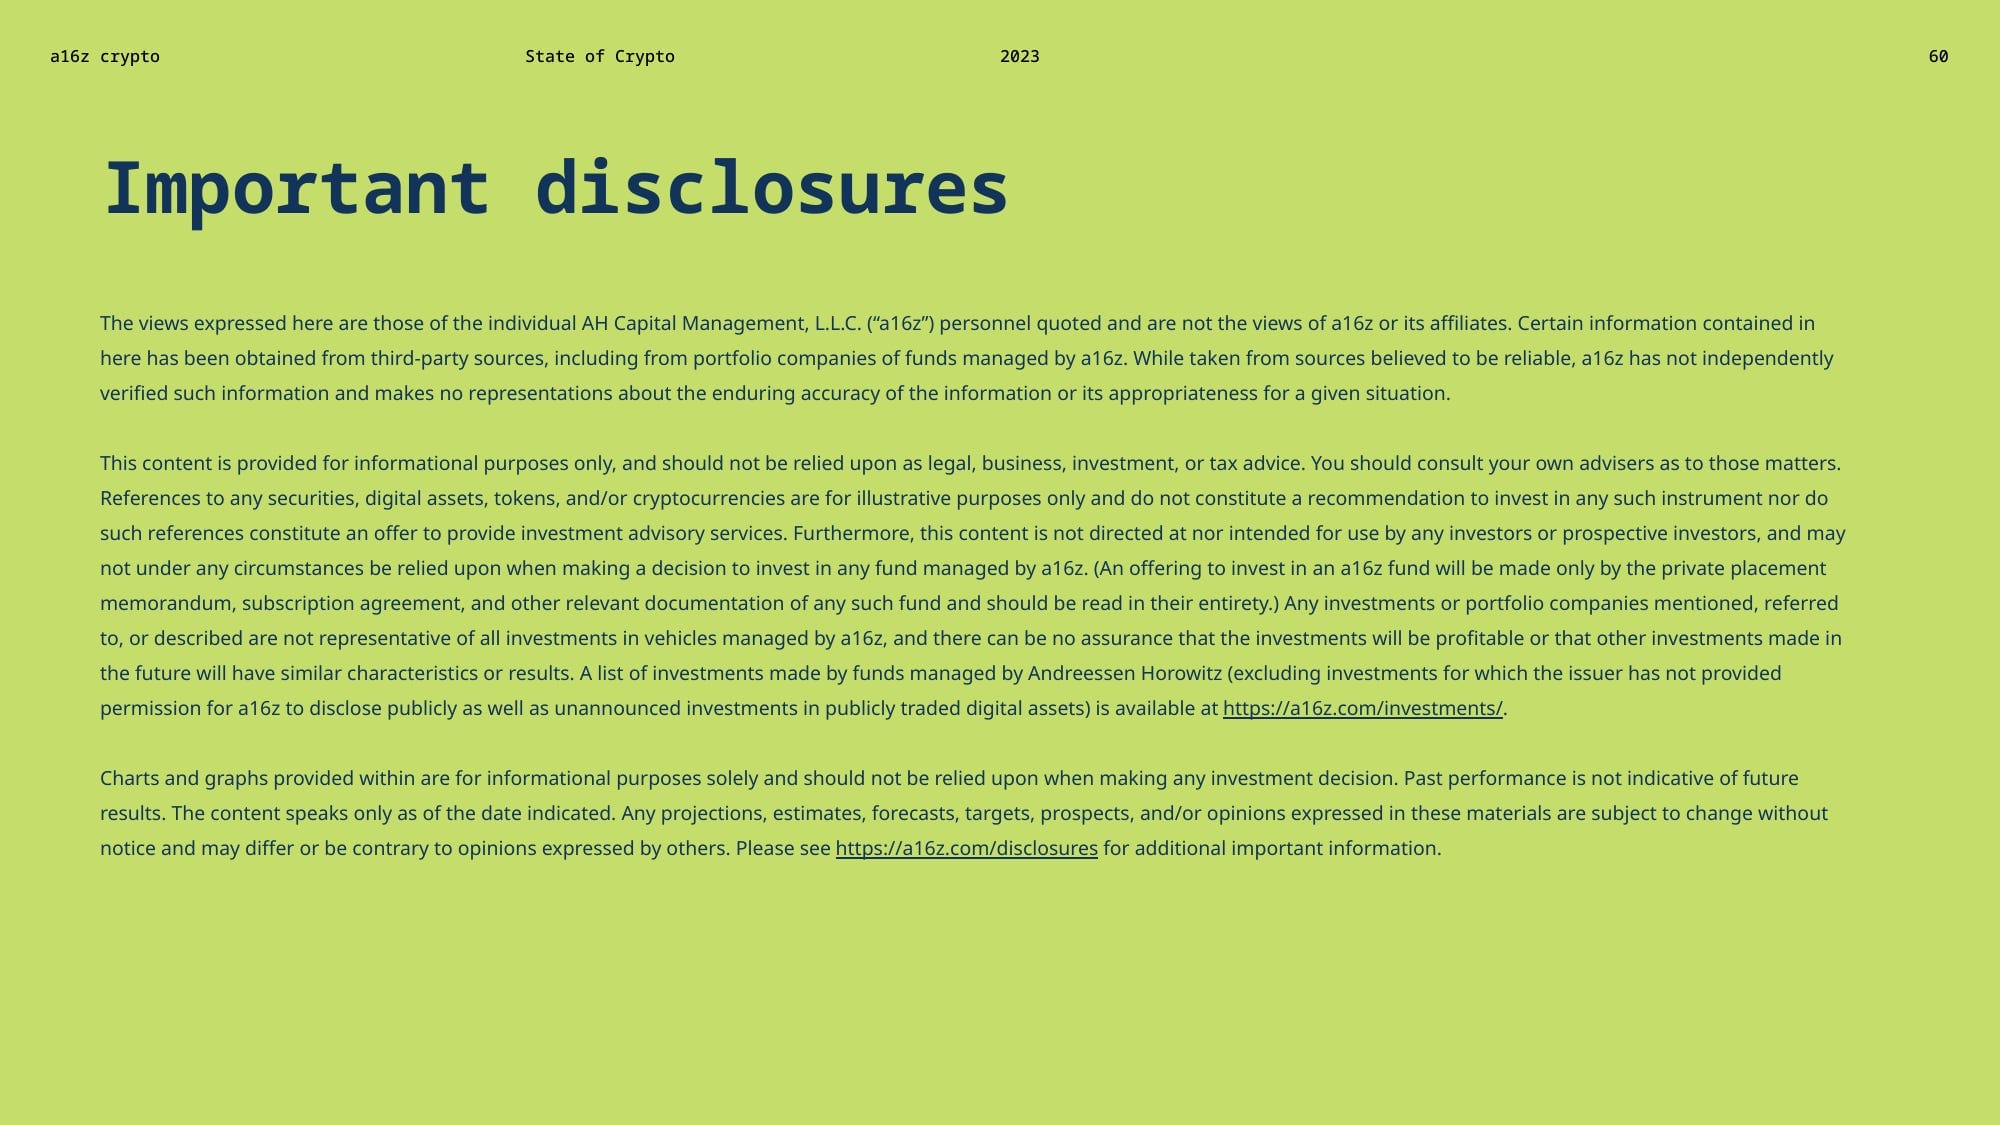
In it, they completely disclaim all information in the report.
Certain information contained in here has been obtained from third-party sources, including from portfolio companies of funds managed by a16z. While taken from sources believed to be reliable, a16z has not independently verified such information and makes no representations about the enduring accuracy of the information or its appropriateness for a given situation.
They also include language about how readers are not to take the report as any kind of advice (business, investment, or otherwise) or as endorsement of any cryptocurrencies, and they write that the report "may not under any circumstances be relied upon when making a decision to invest in any fund managed by a16z".
But, of course, they would not publish the report in the first place if they did not intend people to read and be influenced by it, and it is more than a little silly to suggest that reprinting information in a big "Andreessen Horowitz State of Crypto 2023" report does not put their reputation behind it. For that reason, you'd think they might have decided to independently verify the claims they've spent a year compiling, but — as you will see — that would conflict with the "crypto is going wonderfully" narrative they aim to promote.
The shift away from price metrics
This is Andreessen Horowitz's second "State of Crypto" report. The first was published on May 17, 2022, and although crypto prices had come down from the highs of six months before, there were still people who believed that was a brief price blip rather than the start of a more protracted downturn.
With the use of some extended x-axes and creative (and undisclosed) data cut-offs, they were able to make it appear that crypto prices could still be on a rocket trajectory. For example, take this chart of "global crypto market cap". Looks compelling! Up only, which they helpfully illustrate with the crude black arrow in case those pesky "down" portions of the graph were threatening to confuse the message.
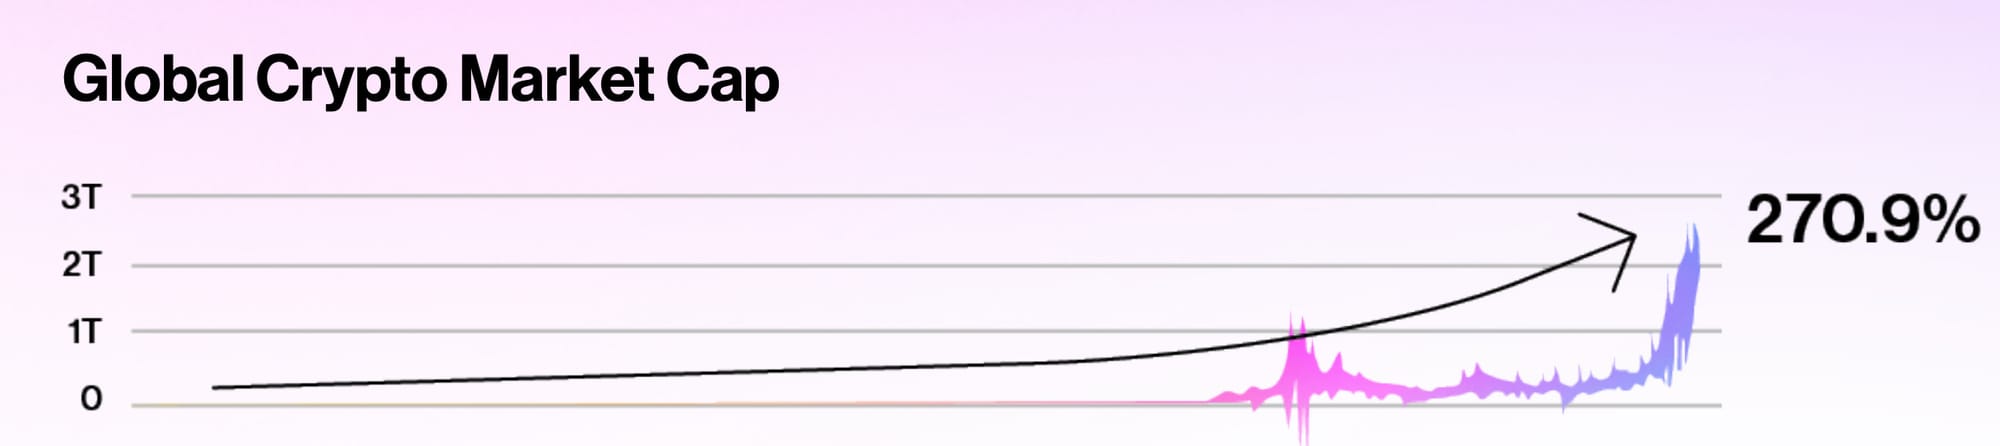
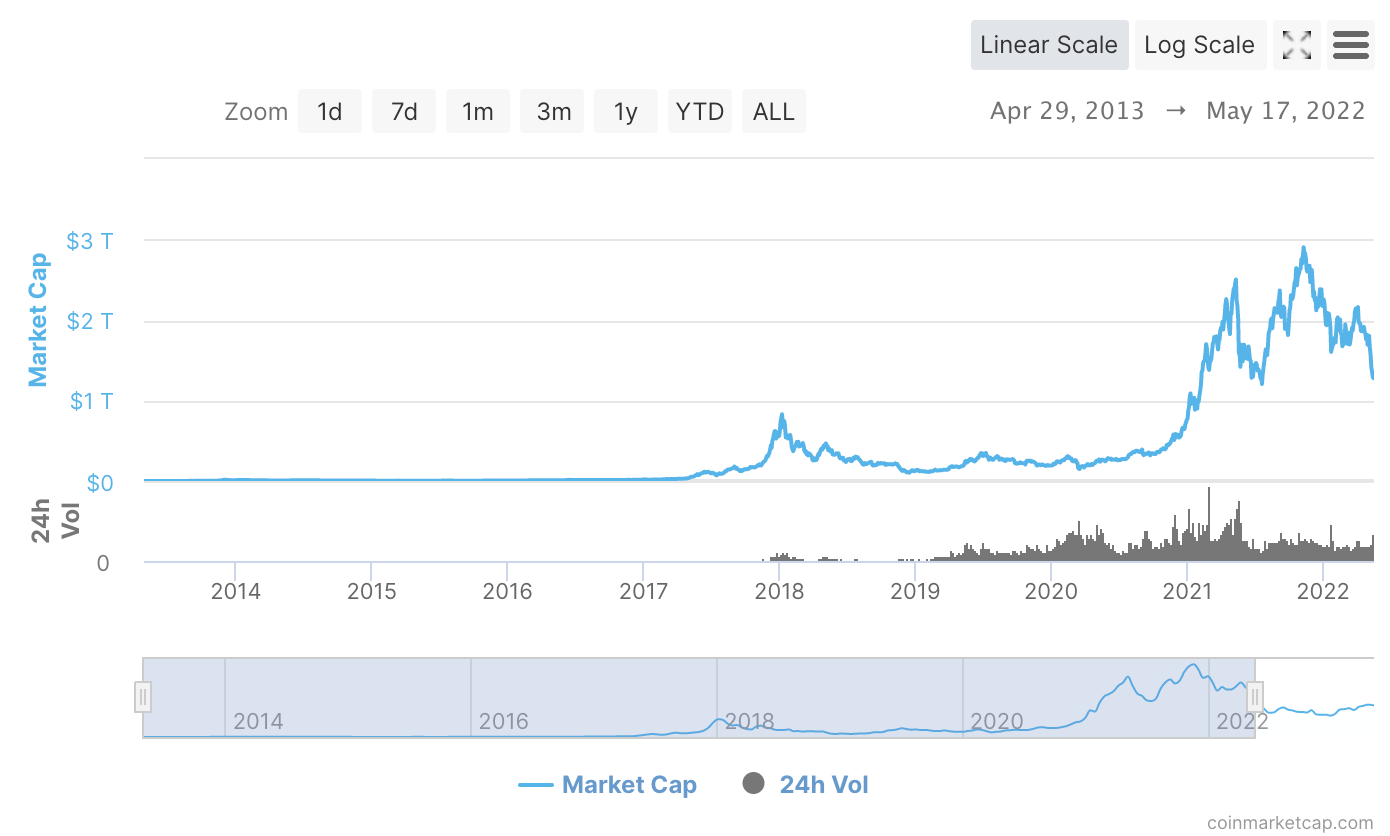
To their credit, they do cite their sources — in this case, CoinMarketCap. This allows us to pull the same data from the same source, as of the time at which the report was published:
Hm.
I have taken the chart through May 2022, overlaid it on a16z's, and massaged it a little bit to fit, which produces the following (note I've turned it into grayscale to help with visibility):
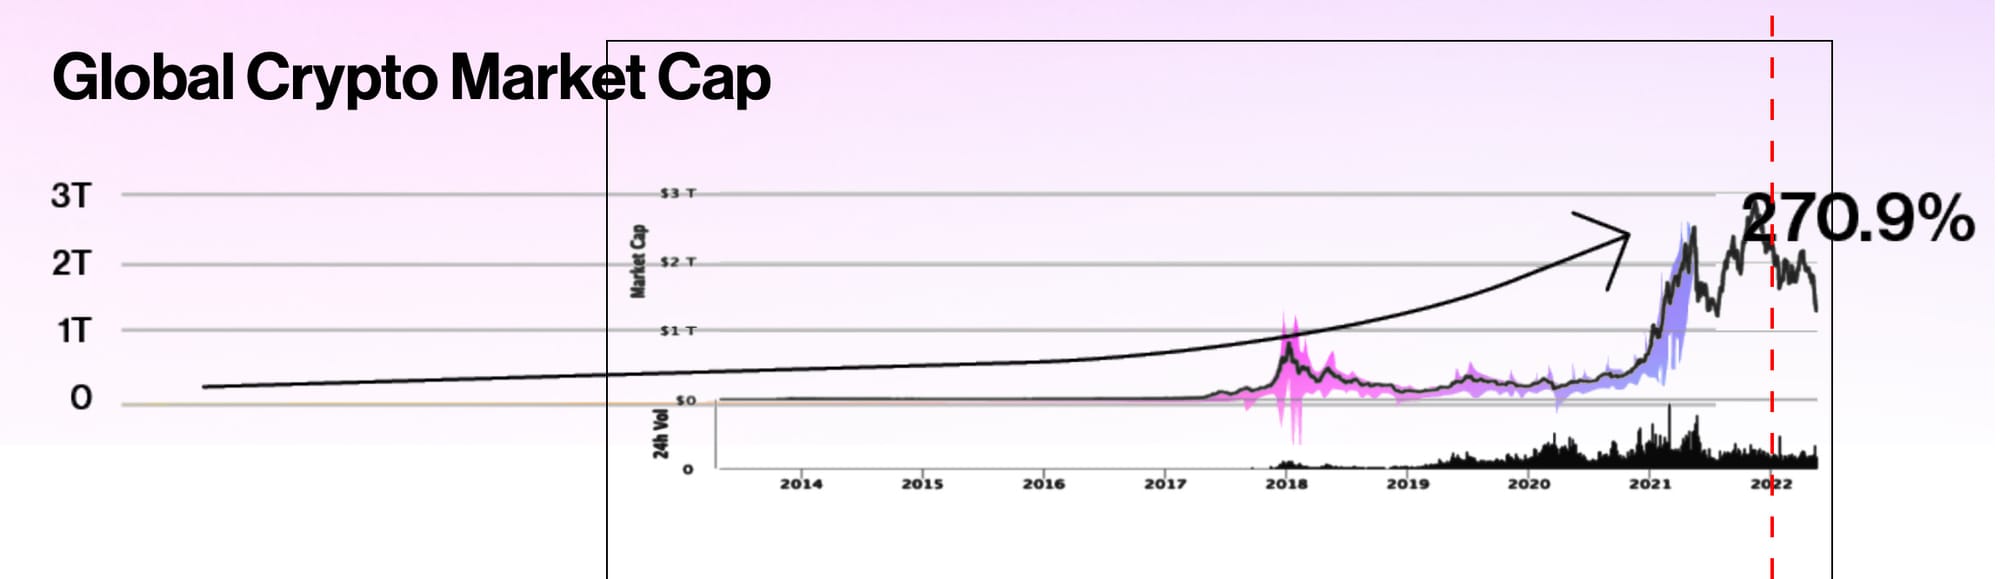
This allows us to see how a16z cut off the data at roughly May 2021, despite claiming on that slide that the data was as of December 31, 2021 (marked by the red line), and despite in later slides using data through May 2022. This omission conveniently elides the downturns in mid and late 2021 that might make readers notice that "hmm, sometimes crypto prices do go down".
This year, however, they would have to cut out about a year and a half of data to make price-related (and many other) charts look like they're going up. That's harder to get away with, so instead they've switched tacks: now they're claiming those same dollar amounts they used a year ago are the wrong way to measure crypto "health", and have introduced new metrics entirely.
Let's dig in.
a16z claims to want to take away its own revenue stream
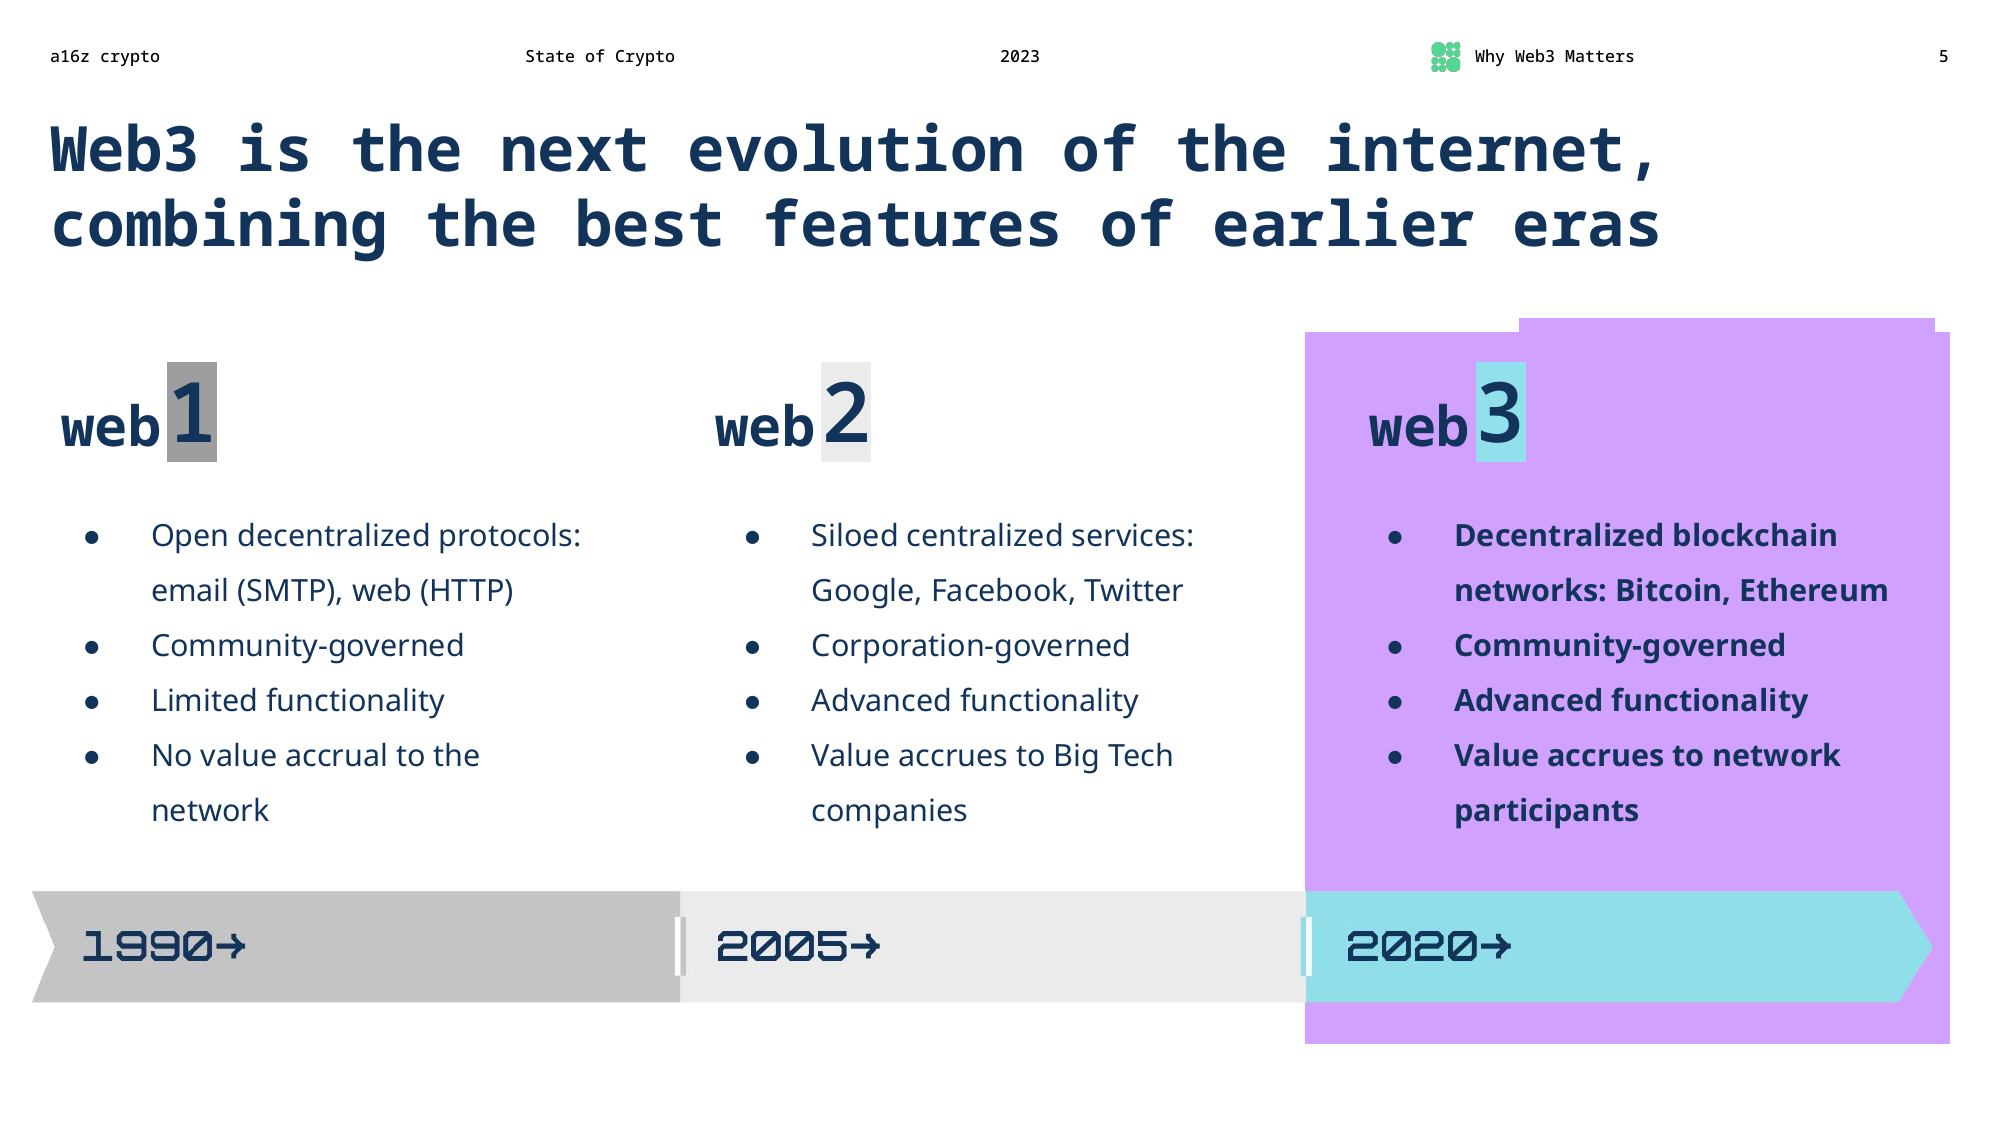
Andreessen Horowitz begins the "Why Web3 Matters" section of the report by repeating a similar refrain as they did in the 2022 report: "web3 is the next evolution of the internet". They fail to mention that while the columns describing the "web1" and "web2" eras describe actual changes in the web, the "web3" column remains wholly aspirational despite its supposed 2020 start date.
At this point, a critical reader should be wondering why Andreessen Horowitz — a venture capital firm that has backed (and continues to back) some of the largest Big Tech firms, and whose entire business model relies on accruing value to themselves and their investors — would be interested in something that was truly "community-governed" where "value accrues to network participants".
Web3 vs. web2 platform revenue share
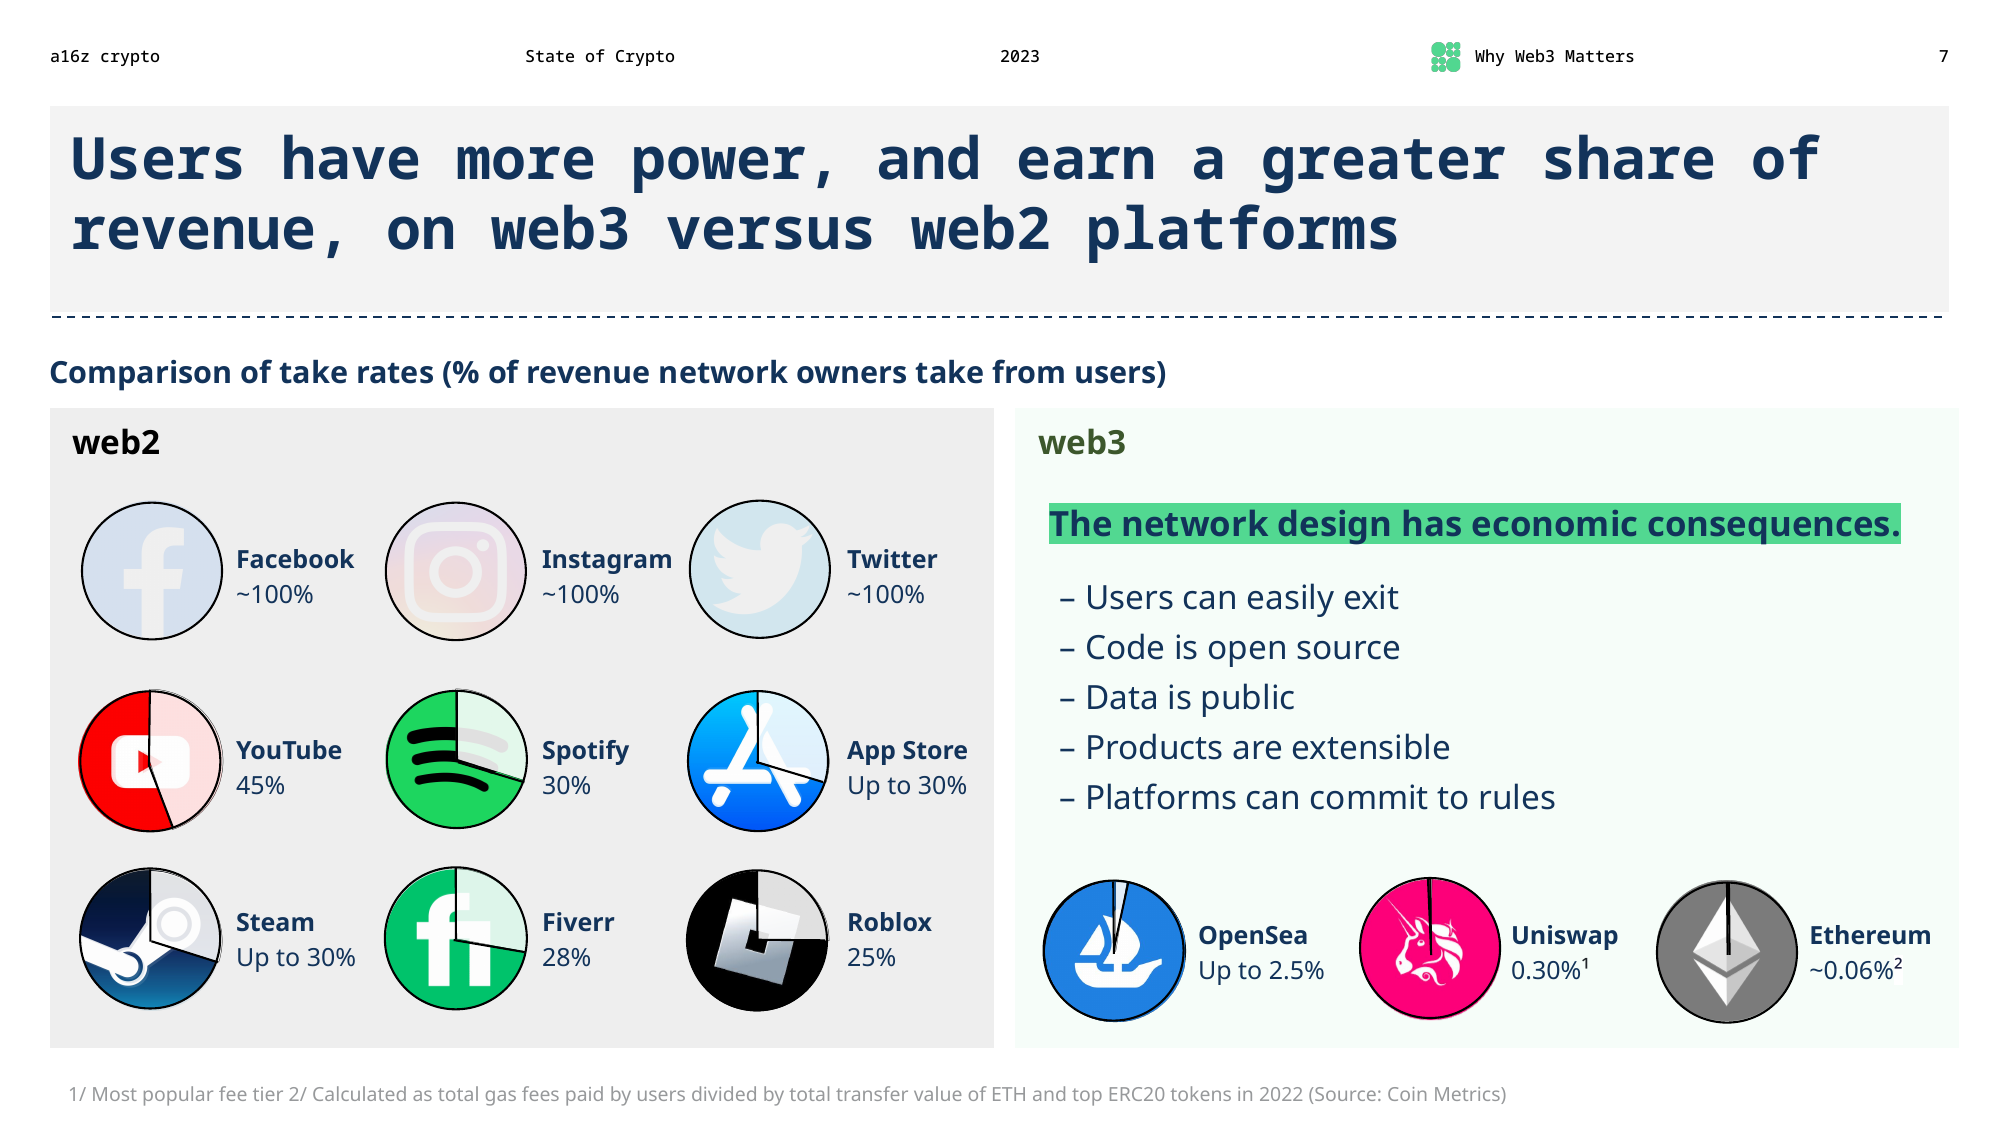
This is a bizarre slide in a few ways.
For one, Andreessen Horowitz claims that Facebook, Instagram, and Twitter have "100% take rates", ignoring that plenty of people monetize those platforms or sell goods through them with much more reasonable take rates. Facebook and Instagram Shops take a 2.9% fee, for example.7 Meta has various programs where creators on Facebook and Instagram can monetize music, reels, exclusive content, and other products, and the company currently doesn't take any cut.8 Twitter has subscriptions and tips, and had a paid newsletter product until earlier this year.9 A16z is presumably using the 100% take rate to refer to the fact that most people are not generally paid to post on these platforms, but that's also not what most people are using those platforms for.
The comparisons in this slide are largely apples to oranges, probably because there aren't that many robust web3 projects that are widely providing services like the web2 companies they've chosen. OpenSea is an NFT sales platform, Uniswap is a crypto exchange, and Ethereum is… just the network itself (and you have to pay those Ethereum fees when you use platforms built atop them like OpenSea or Uniswap). A16z could've included some blockchain-based social networks to compare with Facebook, Instagram, and Twitter, but then they might've had to point out that the take rate on those can actually be greater than 100% — because on some of these services (like Twetch) you have to pay to post, comment, follow, like posts, or perform any other interactions.10
Secondly, it's a bizarre slide because Andreessen Horowitz has backed some of these very same companies they're denigrating, or companies much like them. Some of Andreessen Horowitz's earliest and most profitable investments were in Facebook and Twitter. They also invested in Instagram and Roblox. They've invested in Fiverr competitors Toptal (fees taken from clients) and Gigster (unclear fees11), and YouTube competitor SocialCam (defunct after acquisition), FilmHub (20% fee), and Caffeine.tv (50% fee). Most12 of these remain proudly on their website. And many companies in their active portfolio are decidedly "web2", taking quite similar fees as the platforms they're denigrating here, like Medium (50% fee), Substack (10% fee), Shef (25% fee), and Clubhouse (100% fee, if we're going with the Facebook/Instagram/Twitter take rate calculation).
Finally, a16z erroneously suggests that only with web3 can projects be open source, extensible, or committed to rules. Not only can "web2" projects follow this model, many web3 projects are none of these things!
Good crypto vs. bad crypto
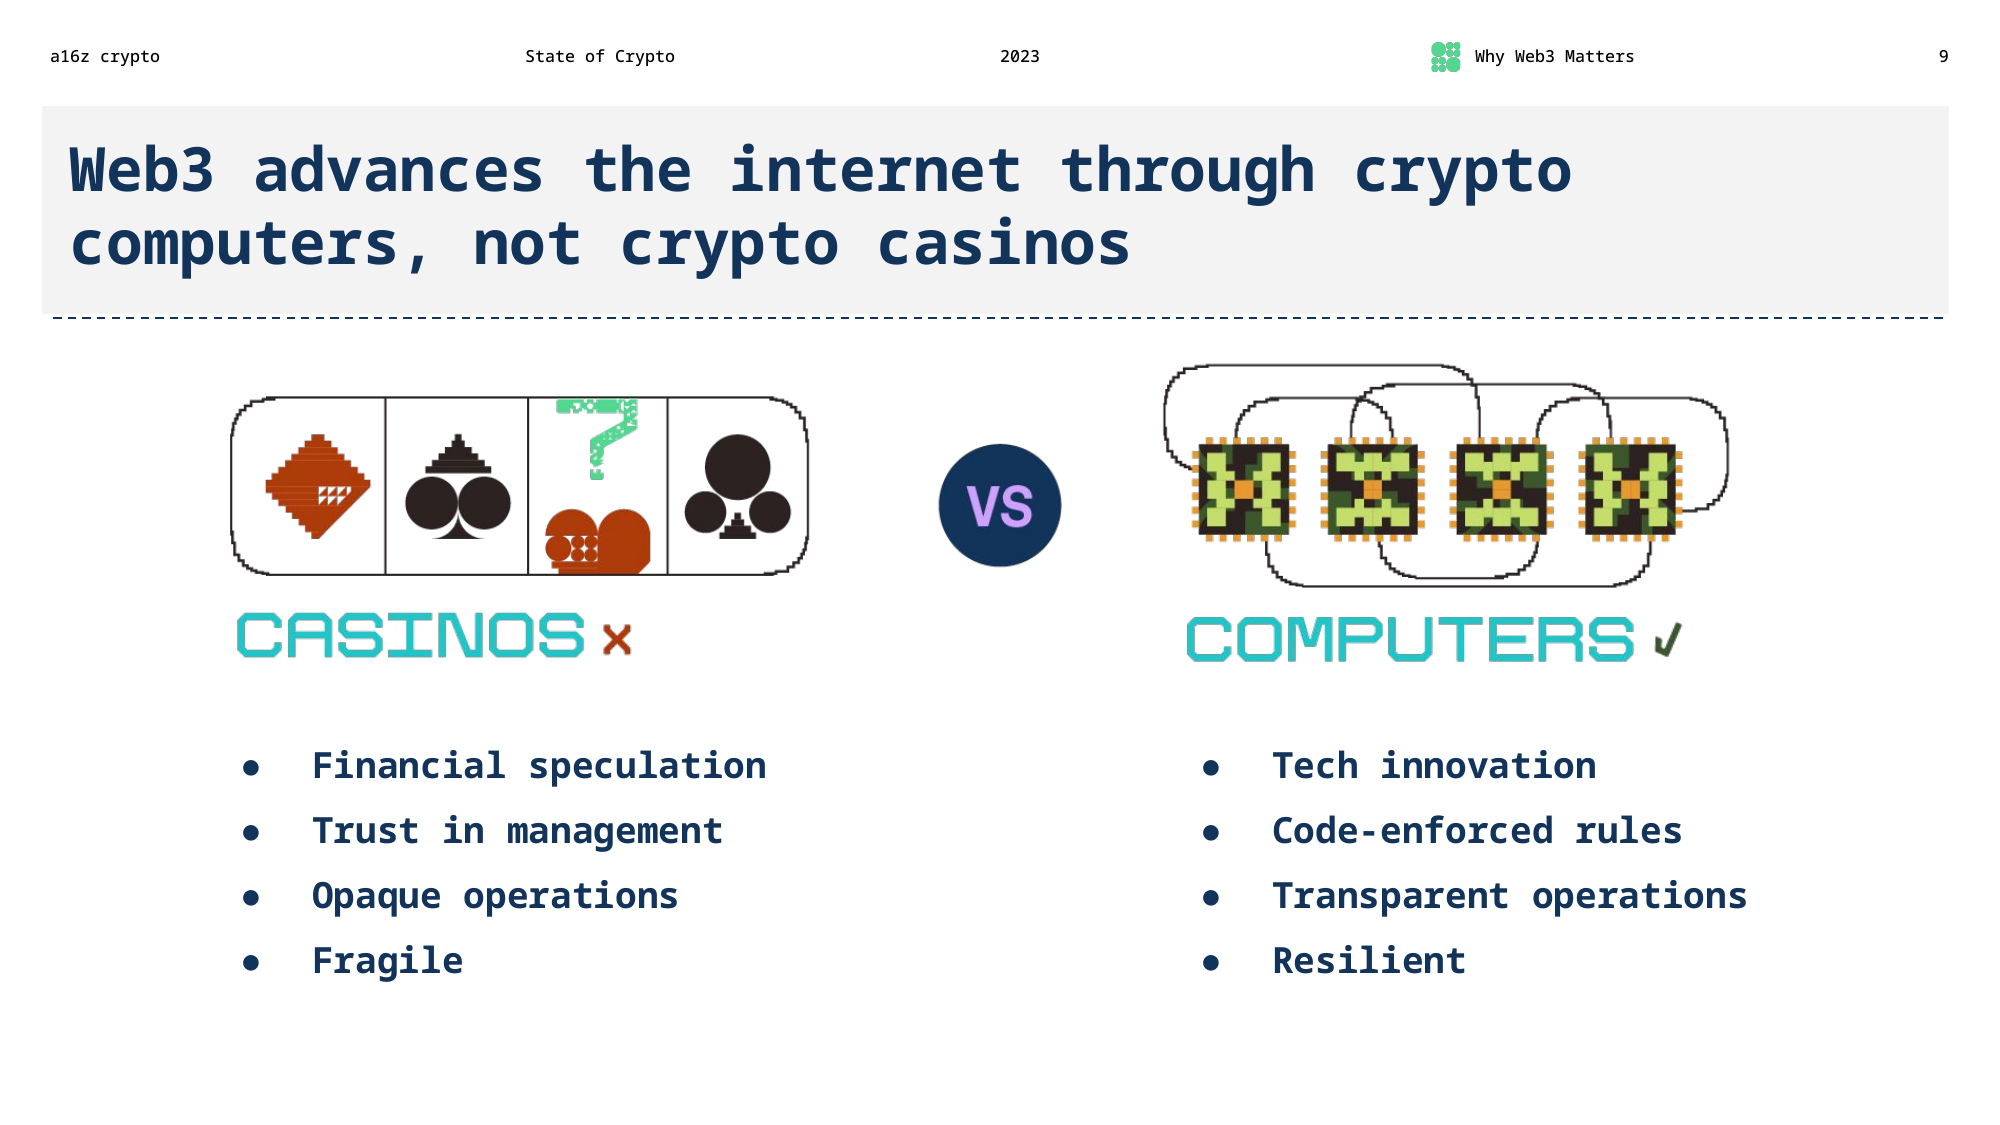
Now we see a16z come about as close as they ever do in this report to acknowledging the raging tire fire that was 2022 in the crypto industry. They're employing what has become a common industry tactic here: bucketing all the failed crypto projects into a "bad crypto" bucket, while surviving ones go in the "good crypto" bucket. If at any point a project in the good crypto bucket fails, just move it to the bad crypto bucket and hope that no one remembers if you talked about it being in the good crypto bucket.
Their "bad" bucket bullet points follow the standard industry talking point: that the collapses of Celsius, Voyager, FTX, and others were failures of centralization and opacity and individual bad apples, not failures of crypto.
Meanwhile, the "good" bucket has some amusing entries, like "code-enforced rules" and "resilient". We've seen plenty of examples recently of cases where supposedly code-enforced rules aren't actually enforced (Oasis, Arbitrum DAO, Juno DAO), or go horribly wrong (Mango Markets, BuildFinance DAO, Compound Finance bug). As for resilience, the a16z-backed blockchain Solana suffered eleven major outages in 2022 (and several other minor ones in that same period). At one point, a sunflower farming game DDoSed the network for several days, massively slowing it down.
Everything is going up and to the right
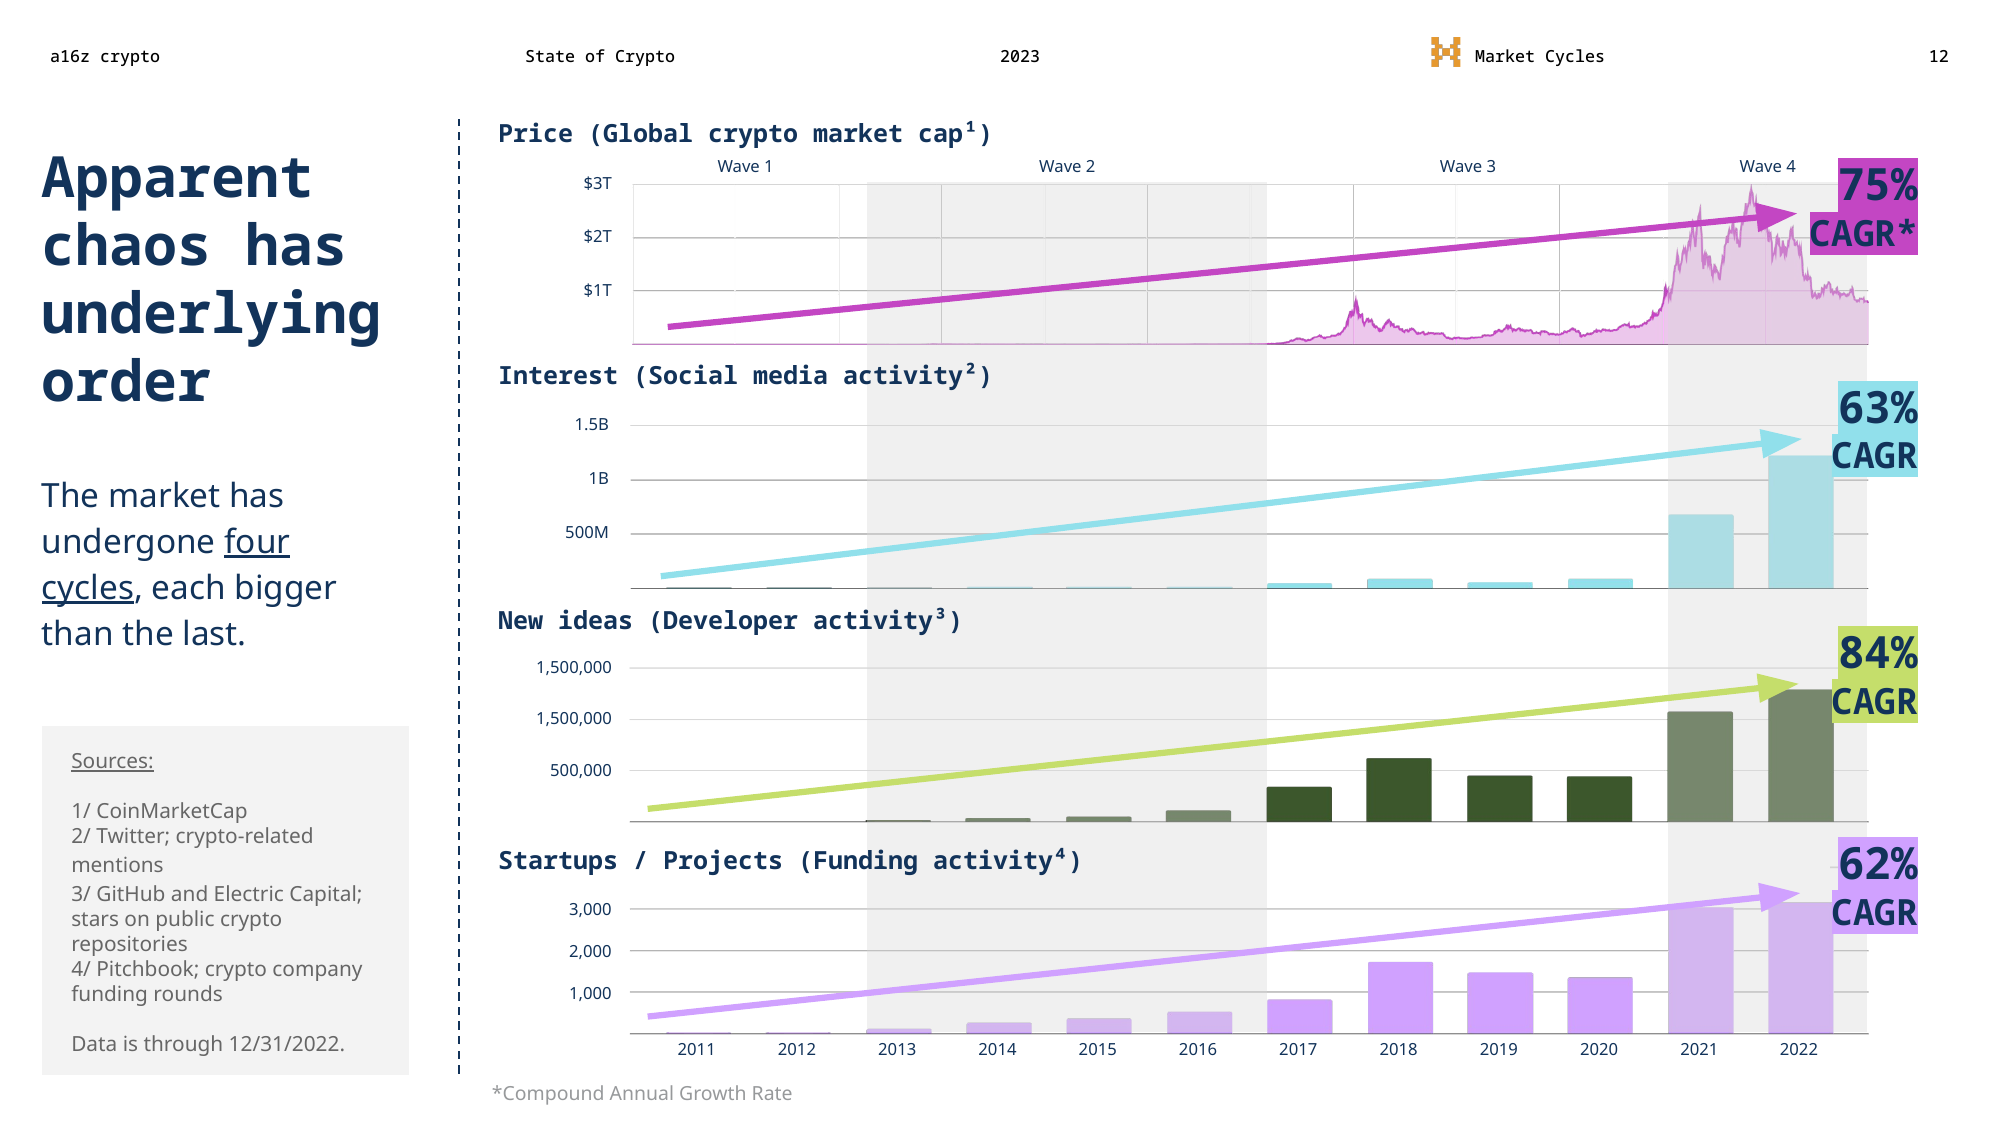
Hold on to your butts because we've got our first chart, and it's a doozy. The arrows are still going up and to the right, that's nice!
Wait a second…
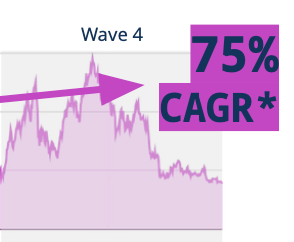
"Maybe if we just stick this text here they won't notice the nosedive" — some a16z data scientist wondering where their life went so wrong, probably. "Maybe we should start measuring from 2008 so we can say it has ∞ % CAGR…"
I've already written extensively about how cryptocurrency "market cap" is a notoriously unreliable figure, so I won't address it at length here, but suffice it to say it's not something that should be presented without serious caveats around data quality.
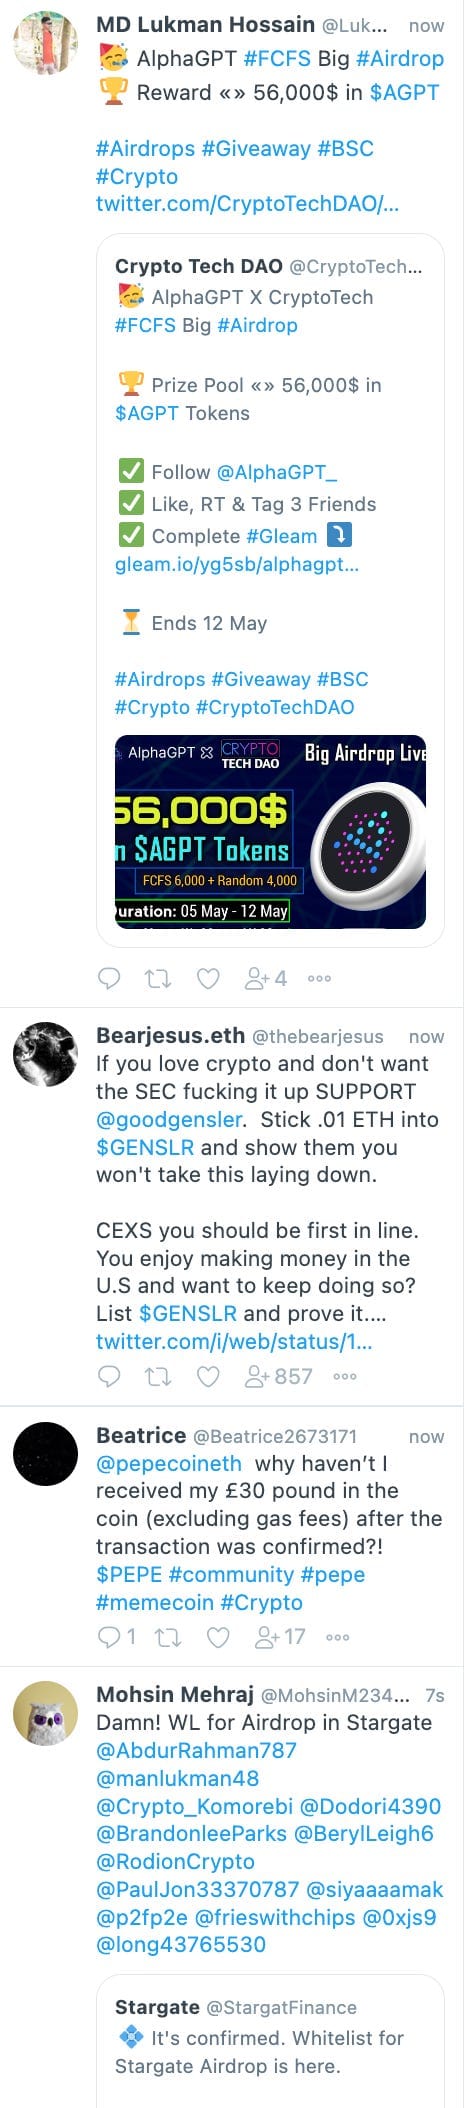
The other three figures in this chart are arguably even worse. "Interest" in crypto, they say, should be measured by "social media activity", which they explain in a footnote they're defining as "crypto-related mentions on Twitter". As someone who mentions crypto a lot on Twitter, I'm a little offended that my tweets are probably being rolled up as "crypto-related mentions" here and used to sell the narrative that crypto is still something people are excited about. But anyone who's familiar with Twitter and crypto knows of something else that might skew these numbers just a little bit:
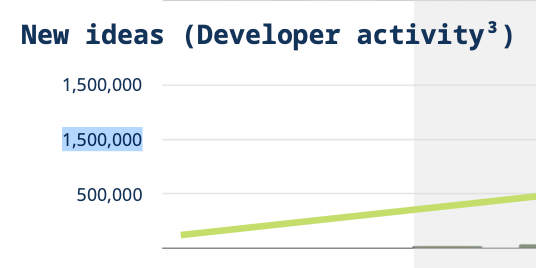
Next up is "new ideas", defined as "developer activity", which they explain is measured by stars (favorites) on public crypto repositories on Github. This is a really weird way to measure "new ideas", because hypothetically all ~1.3 million starsb represented in this chart for 2022 could be on one single old repository, which in fact would just mean there was one really interesting idea a while ago. And indeed there are quite a few crypto-related repos with tens of thousands of stars, many of which are not new (the Bitcoin core repo, for example, has almost 70,000 stars on Github). There's also no apparent attempt to control for increases that could be attributed to Github user growth, which was apparently substantial: the company reported 20.5 million new users in 2022.13 Finally, Github stars are notoriously easy to game and cheap to buy.14
Finally, we have "startups/projects", defined as "funding activity", defined as the number of funding rounds involving crypto companies. The numbers for 2021 have noticeably changed since last year's report, which is weird, but it may be because the 2022 report used "startup activity based on crypto-related initial funding rounds" whereas this year just used any funding round.
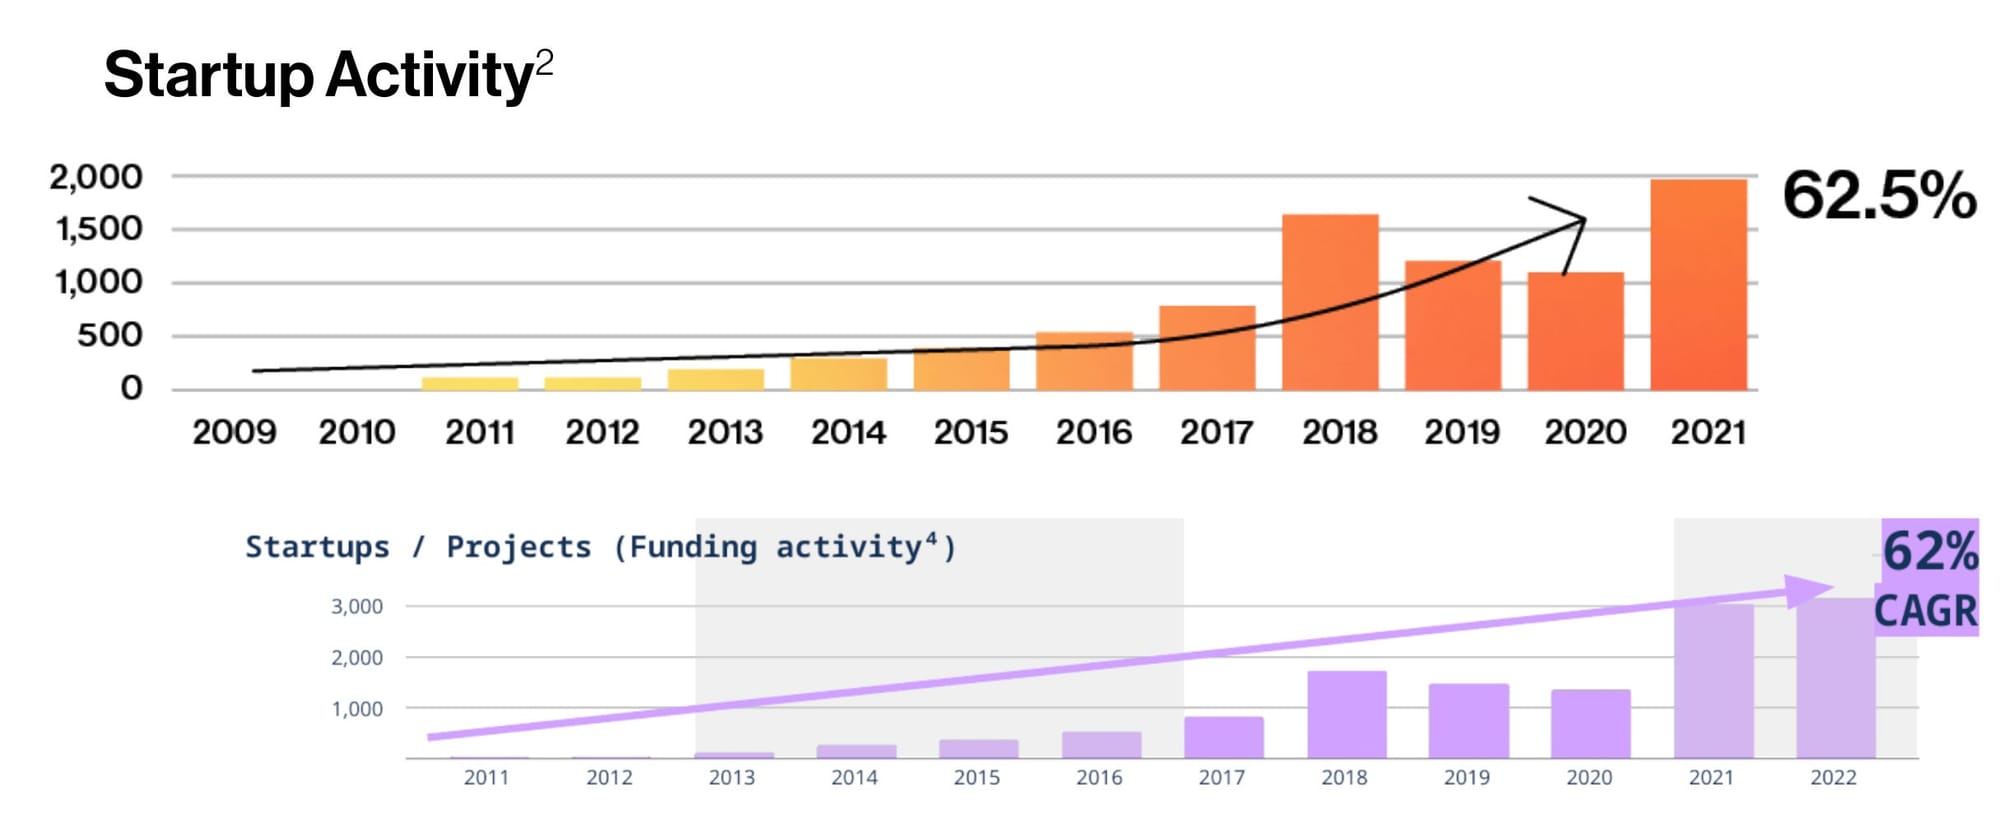
As we can see if I position the charts next to each other, the historical numbers for 2021 got a boost in the 2023 report compared to the prior one, with around 2,000 funded projects in 2021 according to the 2022 report morphing into around 3,000 in the 2023 report. I don't have the requisite access to Pitchbook to look at the source data, but I would bet ten real US dollars that they had to change the metric to keep the chart from dropping off in 2022.
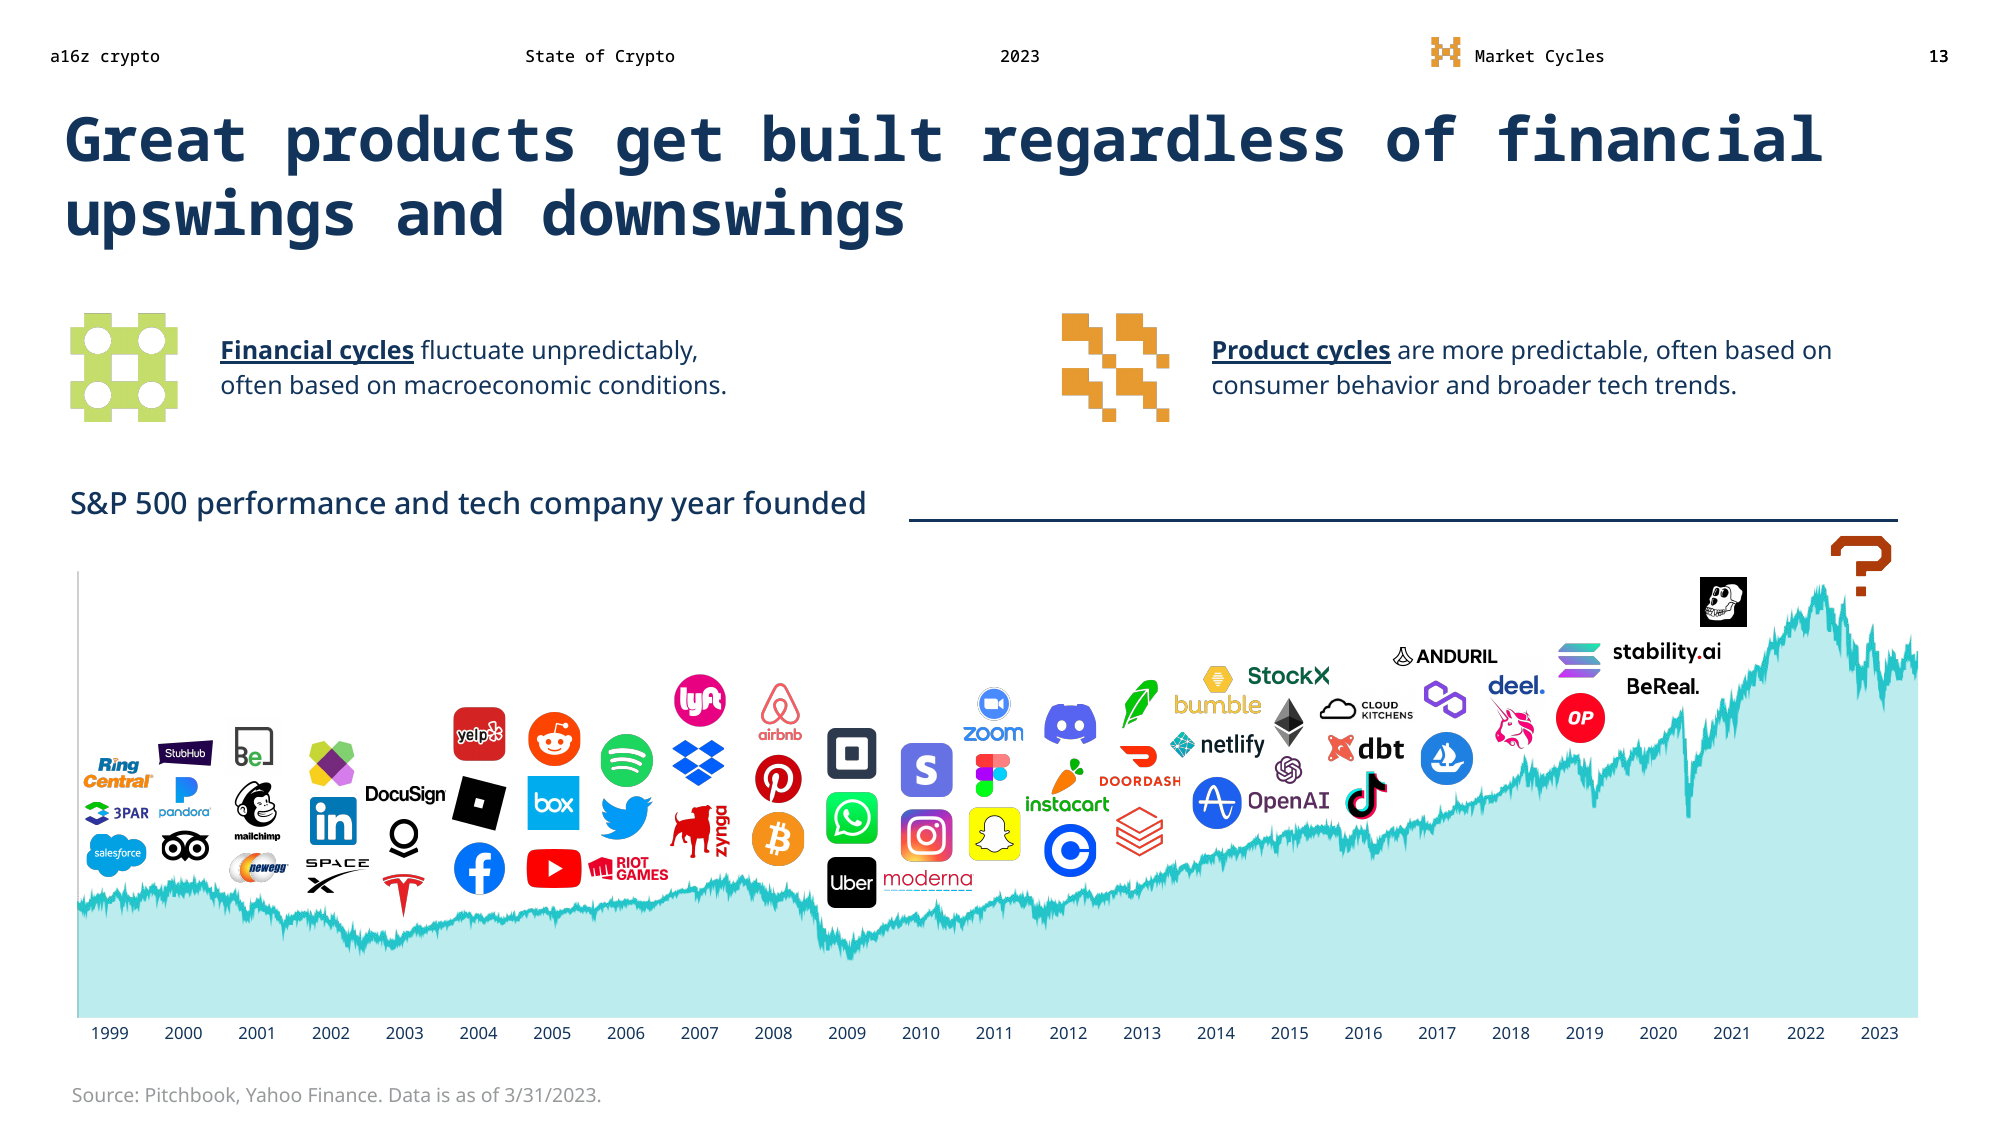
We're in it for the technology
With this slide, a16z begins what will be a recurring theme in this slide deck: "ignore crypto prices now, it's all about the tech!" This echoes the "in it for the tech" crypto meme, a statement many crypto enthusiasts have embraced unironically now that "have fun staying poor" price gloating doesn't work so well anymore.
Here, a16z makes the reasonable choice to plot company inception against the S&P 500. After all, it would be weird if they plotted the emergence of a company like Docusign against the Bitcoin price, so I have no complaints there. But it does show that they are making the assumption that impact on companies (crypto-focused and otherwise) from fluctuations in the stock market maps to impact on companies by fluctuations in the crypto market.
I'm not sure this holds up to scrutiny, because most of the companies in this slide (with the exception of Robinhood) do not have business models that are directly reliant on the performance of the stock market. Downturns in the stock market might impact many of these companies' ability to raise funding, for example, but downturns in the crypto market directly affect the ability of crypto companies to attract new users and, ultimately, build a successful product.
Putting that aside, it's also apparent by comparing this chart to the slide immediately preceding it that the S&P 500 doesn't endure swings nearly as dramatic as the crypto markets. Amusingly, the one company that emerged in the wake of the most drastic S&P 500 dip according to this chart is… Yuga Labs. If that's the kind of business we should come to expect from dramatic market downturns, we're all in for a real treat in the crypto industry after the price carnage of 2022–23.
Blockchains can scale
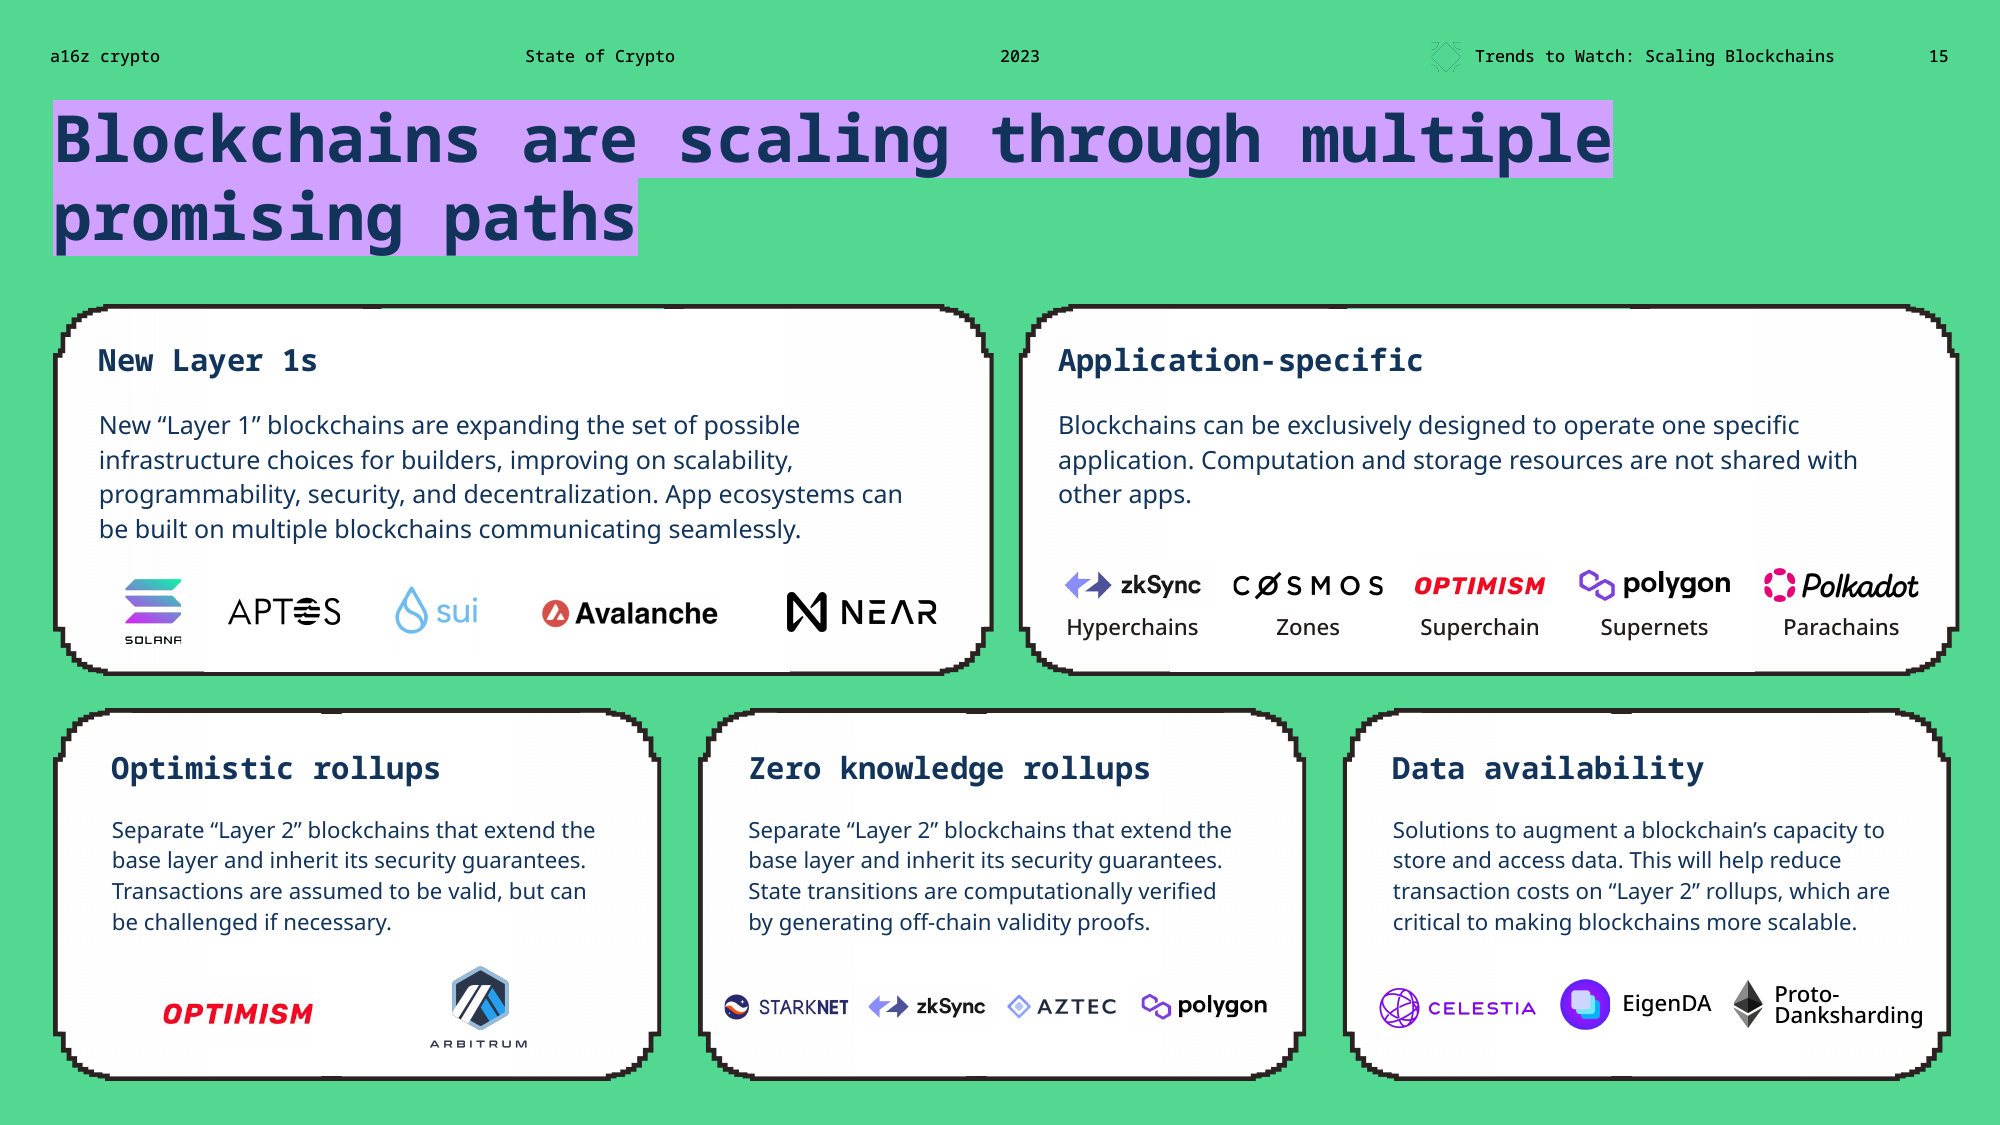
I won't go through the nearly 20 products a16z has stuffed into this slide, but just some greatest hits on these "promising paths":
Solana: notoriously unstable, with at least eleven major outages in 2022 alone
Aptos and SUI: despite being marketed for their speed, both launched with a blistering… 4 transactions per second (Aptos, Sui). As I write this Aptos is doing around 7 TPS, a number which peaks between 30 and 100 on most days.15 This is a far cry from the peak 160,000 TPS advertised before launch, but in their defense is likely because there's not enough demand to produce that kind of speed. Sui promised 10,000–300,000 peak TPS, and is doing around 5 TPS.16
Optimism: the project that got off to a rollicking start when they sent 20 million OP tokens to the wrong place.
Arbitrum: the project that told everyone it was going to move to a DAO governance model, away from their previously centralized team structure, and then ignored that the DAO voted against distributing 750 million ARB tokens (priced at around $1 billion) to themselves.
Environmental objections have been eliminated
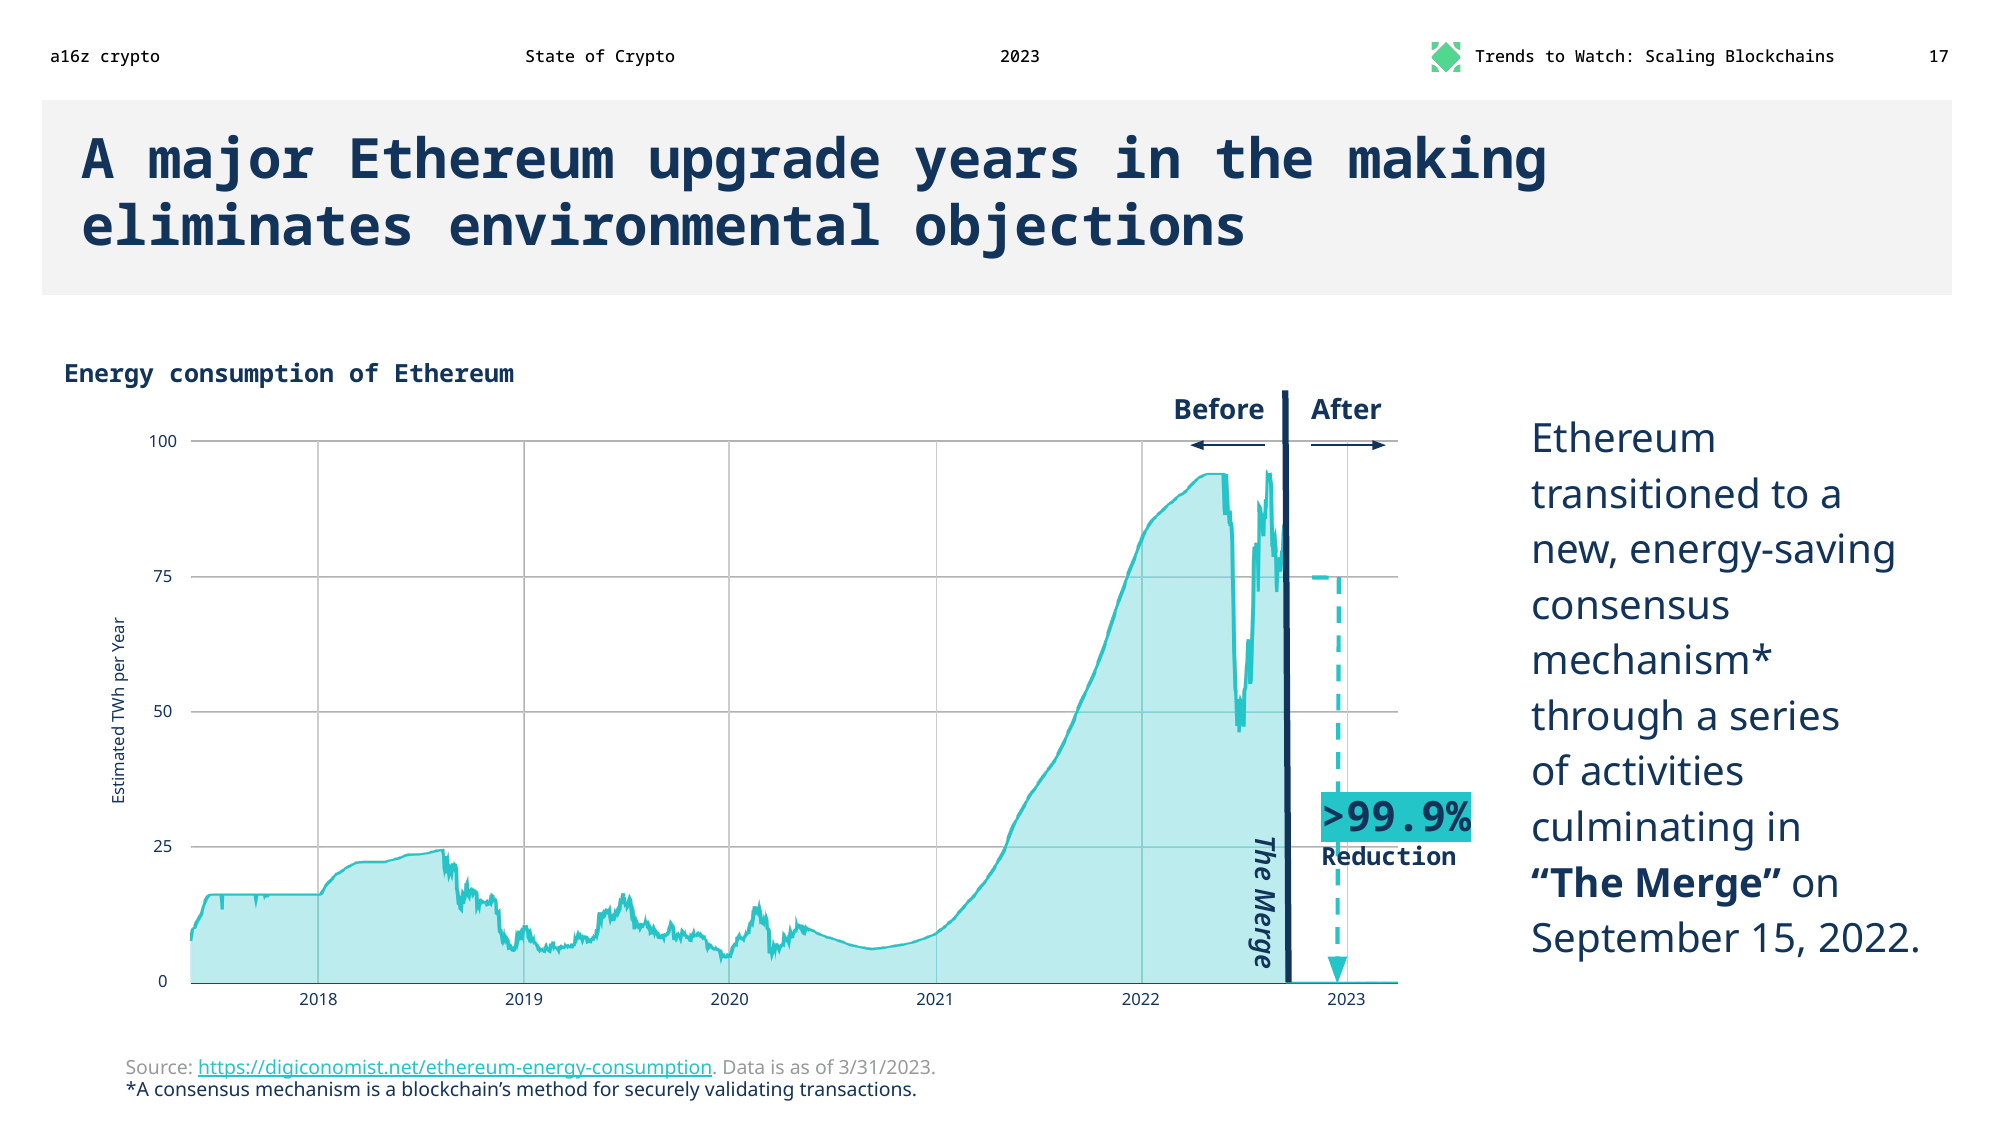
A16z might be able to state that The Merge "eliminates environmental objections"… to Ethereum. Even then, they gloss over the fact that it remains less energy-efficient than centralized systems, though it's hardly at the magnitude as pre-Merge.
Given they discuss Bitcoin throughout this report, it seems a little disingenuous to say that environmental concerns have been eliminated. It's correct that The Merge greatly reduced Ethereum's energy consumption, which is excellent! But Bitcoin still has a massive carbon footprint, which is currently comparable to that of the entire country of Peru. Its electricity consumption is comparable to that of Kazakhstan. If Bitcoin itself was a country, it would rank 34th in terms of energy consumption.17
Ethereum uses less electricity than Bitcoin, which uses less electricity than global data centers, which uses less electricity than... YouTube?
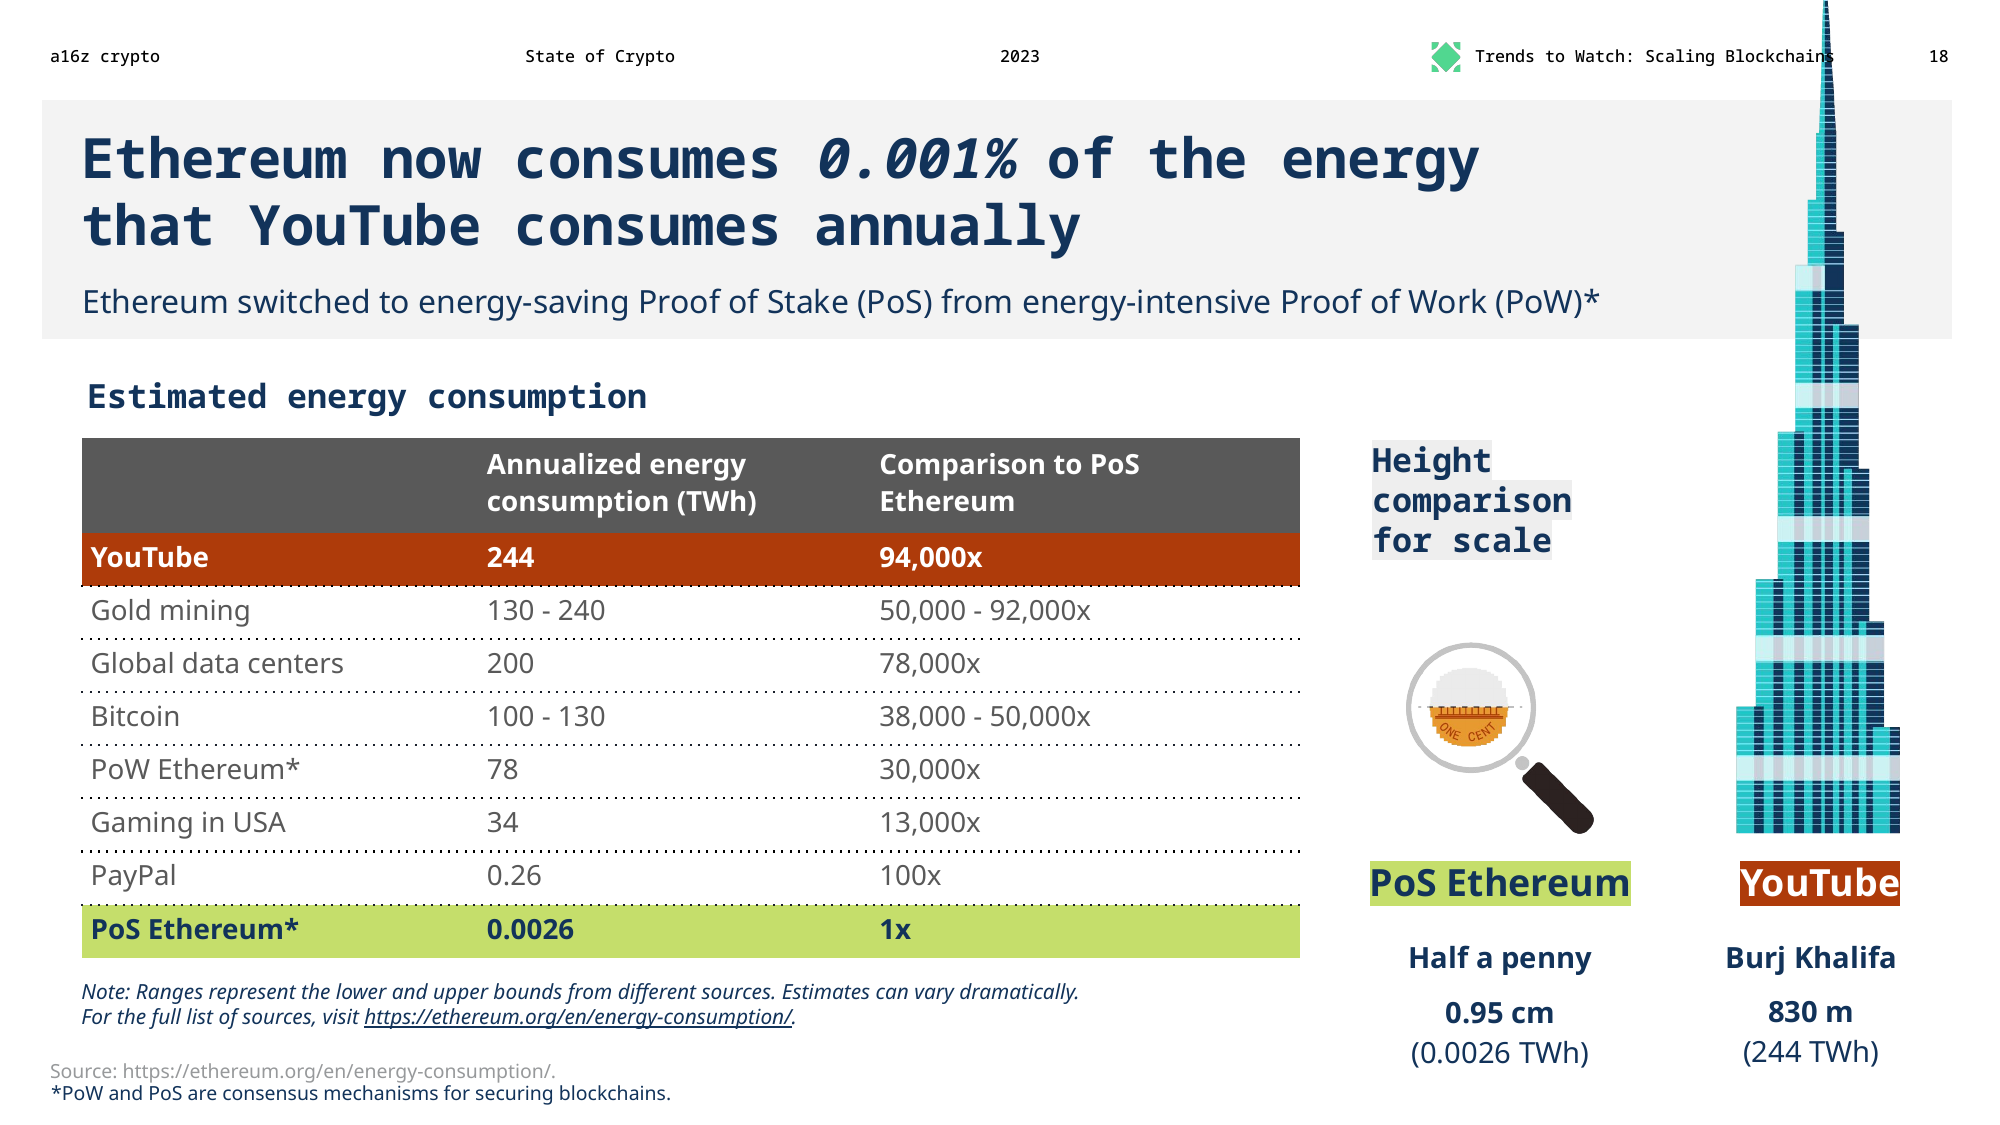
This is easily the most egregious slide in the report. In an episode of their "web3 with a16z crypto" podcast devoted to discussing this report,18 lead data scientist Daren Matsuoka seemed to try to distance a16z from these comparison numbers somewhat. I would too, if I was someone with the job title of "data scientist" at that company. The interviewer referred to "some questions" received by a16z about the slide — not sure if they were mine or someone else's — so I think they're aware that this slide contains complete falsehoods. Normally the realization of such egregious errors would result in a retraction, or at the very least an acknowledgement, but that seems to be too much to expect from Andreessen Horowitz.
The numbers come from a page on the Ethereum.org website, and to be clear, the Ethereum organization should also be ashamed to be reprinting these kinds of claims. But a16z and its data scientists should never have reprinted them without even so much as a glance at whether they were accurate. At no point did anyone seem to ask any of the obvious questions raised by this slide, like "how is YouTube's energy consumption somehow greater than that of all global data centers?"
For the sake of brevity, we will focus on the primary claim here: that Ethereum now uses 0.001% of the annual energy consumption by YouTube. This seems to be a careful sidestep away from comparing Ethereum to its far more natural counterparty, Bitcoin, which is likely motivated by the fact that a16z loves Bitcoin too and doesn't want to impugn it despite all their lip service towards eco-friendliness.
The Ethereum.org page cited at the bottom of the slide includes a table of annualized energy consumption for comparison, and it includes the 244 TWh figure for YouTube along with a link to its own source: The Fact Source: Fun facts, cool science! Looks legit. The website's "about us" and "contact" pages provide zero information about who runs the site.
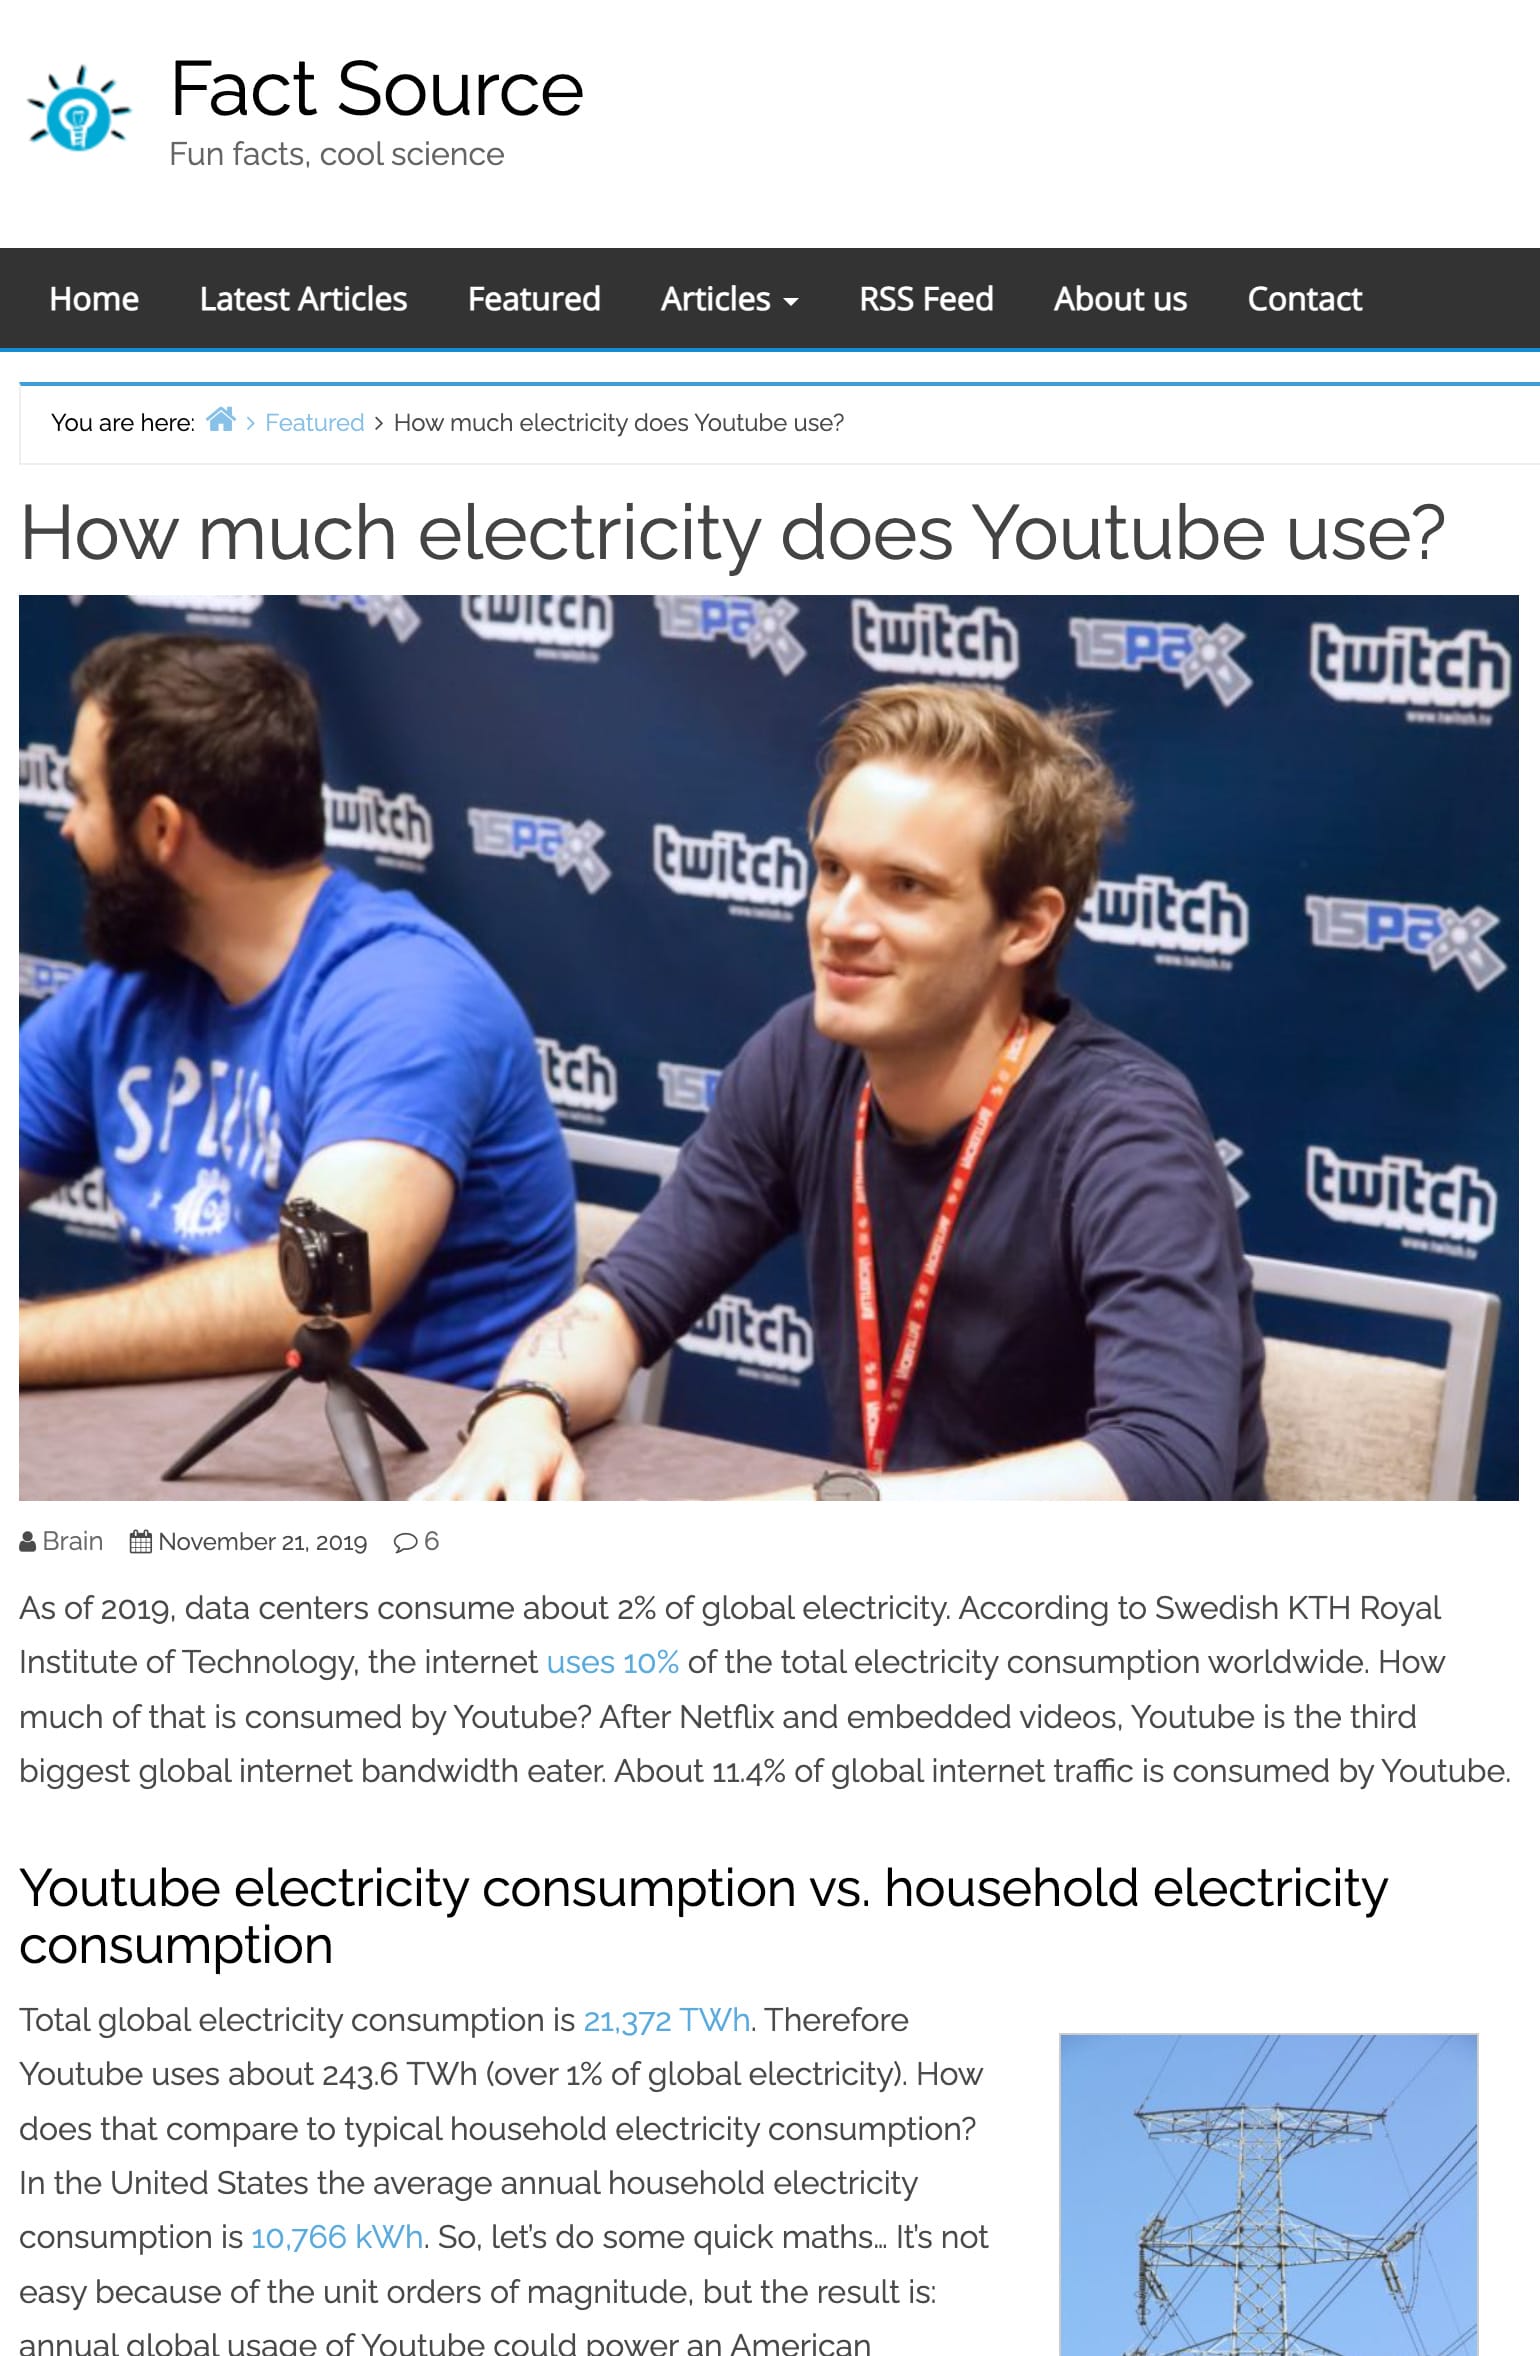
The author of this article does some bizarre and naive calculations: they take a source claiming that "the Internet" uses 10% of global electricity consumption, and a (different, uncited) source claiming that YouTube makes up 11.4% of global Internet traffic in terms of bandwidth, to claim that 1% of global electricity consumption is attributable to YouTube.
I could stop there, given that there are already enough red flags in the assumptions being made to arrive at that calculation that Ethereum.org and a16z should've quickly discounted the source, but let's continue to see just how bad this is:
According to Swedish KTH Royal Institute of Technology, the internet uses 10% of the total electricity consumption worldwide.
Where does this come from? A reputable public research university in Sweden, apparently? Let's see:
The Fact Source cites a (dead, archived) post from March 2019 on Inside Scandinavian Business, a now-defunct magazine once focused on "helping and promoting amazing businesses within Scandinavia and the other Nordic countries". ISB makes the same claim: "Around 10% of the world's total electricity consumption is being used by the internet, according to a recent research report from Swedish KTH." They in turn cite a (Swedish, machine translated) February 2019 blog post on an economics, politics, and prepper blog called Cornucopia, which repeats: "About 10% of the world's electricity consumption is eaten up by the Internet, a research report from KTH shows." However, in the blog post, we can see that the blog author is calculating the 10% number themselves, from extrapolations made by the report's authors based on 2012 data. At the very bottom, the blog author links to this supposed "KTH thesis" (dead, archive). In reality, it is a 2013 article titled "Emerging trends in electricity consumption for consumer ICT" by National University of Ireland, Galway Senior Lecturer Peter Corcoran and Huawei Technologies researcher Anders Andrae. As far as I can tell, it was never formally published in any peer-reviewed publication. The authors don't seem to be affiliated with KTH, and there's no indication that KTH did anything other than (at one time) host a PDF copy of the paper on their website.
You might think it's odd to use 2012 data for a 2019 estimate, and it is, because Corcoran and Andrae were extrapolating (and in fact extrapolating only to 2017, not 2019). Furthermore, their calculations were not solely for global datacenters, but for all consumer information and communications technologies. This counts everything from end-user device usage (of laptops, PCs and monitors, smartphones, tablets, and televisions) to network infrastructure (including cell base stations and wired networks) to datacenters. They believed that, based on their extrapolations, consumer ICT would use between 1,982 and 3,422 TWh by the year 2017. The Cornucopia blog divides these numbers by global electricity production figures from 2017 to achieve the 10% estimate.
This means that the estimate made in a16z's report includes not only the electricity consumption of YouTube, but the consumption of all end-user devices and intermediate networks. The writers are also implicitly assuming that the percentage of Internet usage (by bandwidth) that goes to YouTube can be assumed to be the percentage of electricity usage of all ICT — a clearly flawed assumption. And critically, the estimates of Ethereum's electricity consumption — and the other comparisons made in the report, as far as I've checked — don't factor in network usage to consumers, or the end-user device electricity consumption.
Furthermore, unlike Corcoran and Andrae's report, what has been formally published is "Sources of data center energy estimates: A comprehensive review", published in Joule, which questions the methodology used by Corcoran and Andrae to extrapolate their figures.
Because it's now 2023, Andreessen Horowitz, Ethereum.org, or any of the other intermediate sources in this chain could (and should) have simply looked at estimates of actual global data center electricity use to arrive at a figure, rather than going off of a figure that's (a) extrapolated from 2012 data and (b) takes into consideration far more than just data center electricity use. They themselves include a far lower global data center electricity usage estimate of their own of around 200 TWh, which comes from a reasonable source. 200 TWh is between 10 and 17 times less than the 1,982–3,422 TWh range used by The Fact Source to do the YouTube calculation.
If we used The Fact Source's same (again, extremely naive) technique to calculate YouTube electricity usage, but used the more accurate figure for data center electricity usage, we would arrive at… a bit under 23 TWh annually. This would dramatically change a16z's slide, which claims that YouTube uses 94,000x the energy of PoS Ethereum. If we corrected that to the new figure — around 8,770x — instead of the Burj Khalifa comparison they would need to pick something a little… sillier.

I've edited the slide to show just how erroneous the Burj Khalifa comparison turned out to be:
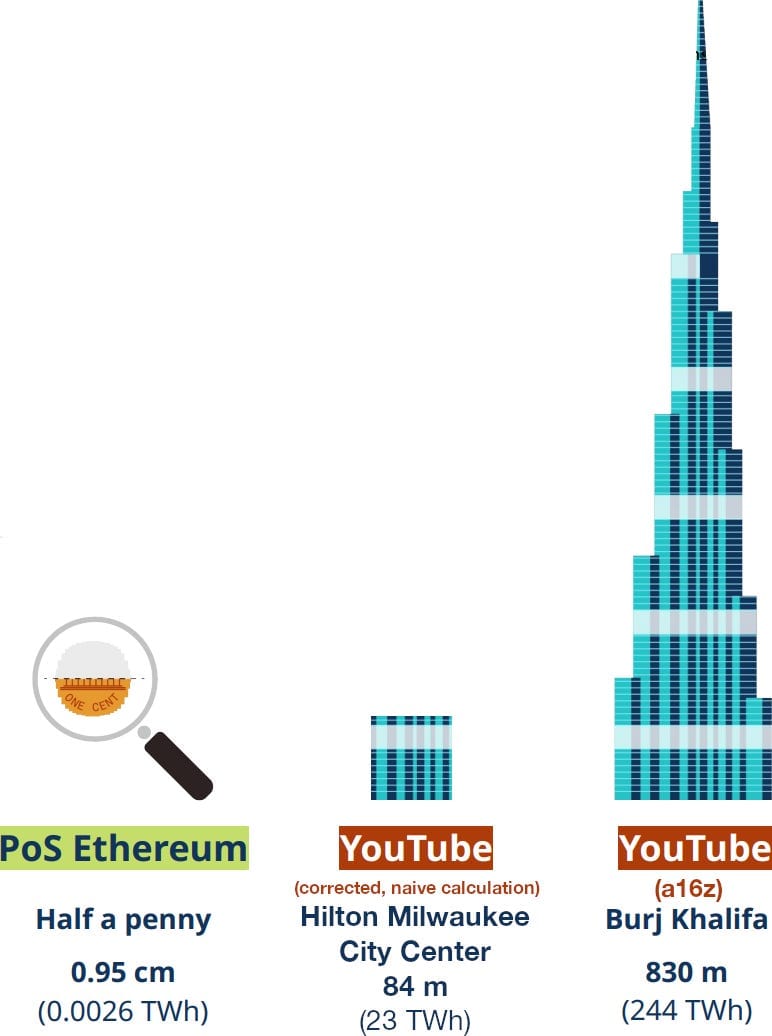
But as I've been careful to point out, this is still an extremely naive way to calculate YouTube's electricity consumption, and still massively overestimates it.
We could instead go by something a little more reliable and see that Google's own annual environmental report for 2022 shows they used 18.6 TWh across the entire company.19 Only a portion of all of the electricity used by Google can reasonably be attributed to YouTube, but I couldn't find more granular figures. Either way, a16z's estimated 244 TWh is off by more than an order of magnitude, and possibly even closer to two orders of magnitude — something that should have been apparent at a glance to whoever wrote the report.
A chart that goes down and to the right
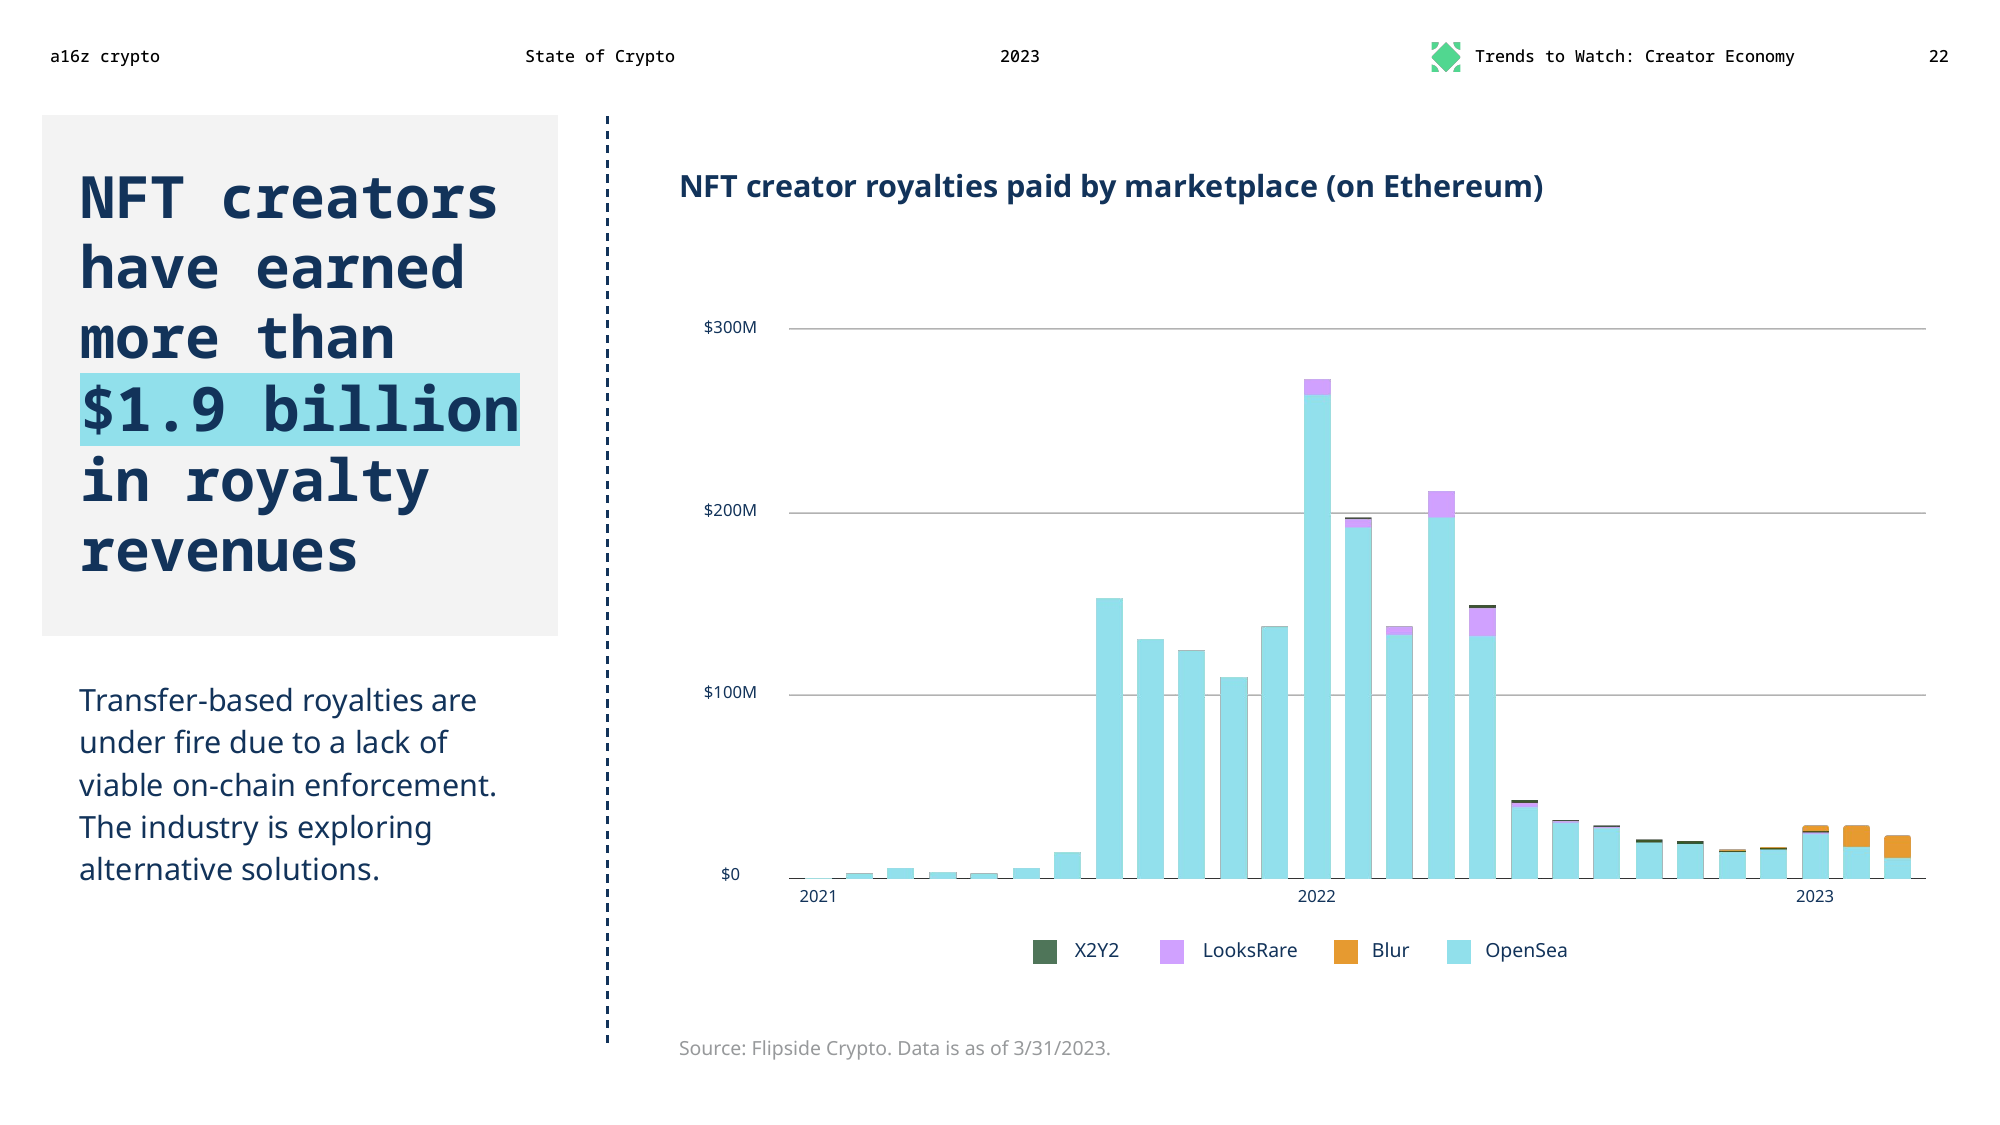
Here's a slide you might think a16z would've skipped, but perhaps they felt the need to include it because they talked about royalties in last year's slides — claiming that artists averaged $174,000 in sales and royalties that year20 in what appeared to be an egregious misuse of mean vs. median along the lines of "Bill Gates walks into a bar, and everyone inside becomes a millionaire, on average."
This year they went with the strategy of "If we put good news in big text and bad news in smaller text, maybe readers will ignore the smaller text and the depressing chart".
Some of this year's downturn can be attributed to the fact that NFT trading in general has fallen off a cliff, and so royalties have gone with it:
However, despite all the talk of how NFTs will ensure artists are paid royalties on secondary sales, these royalties are rarely enforced in the code, and instead were left up to platforms to enforce. As NFT profits dried up, more and more platforms stopped enforcing creator royalties, kicking off a race to the bottom where other platforms slashed royalties to try to remain competitive. Nothing about this spells good news for NFT creators.
Huge brands have discovered they can make a quick buck with little effort
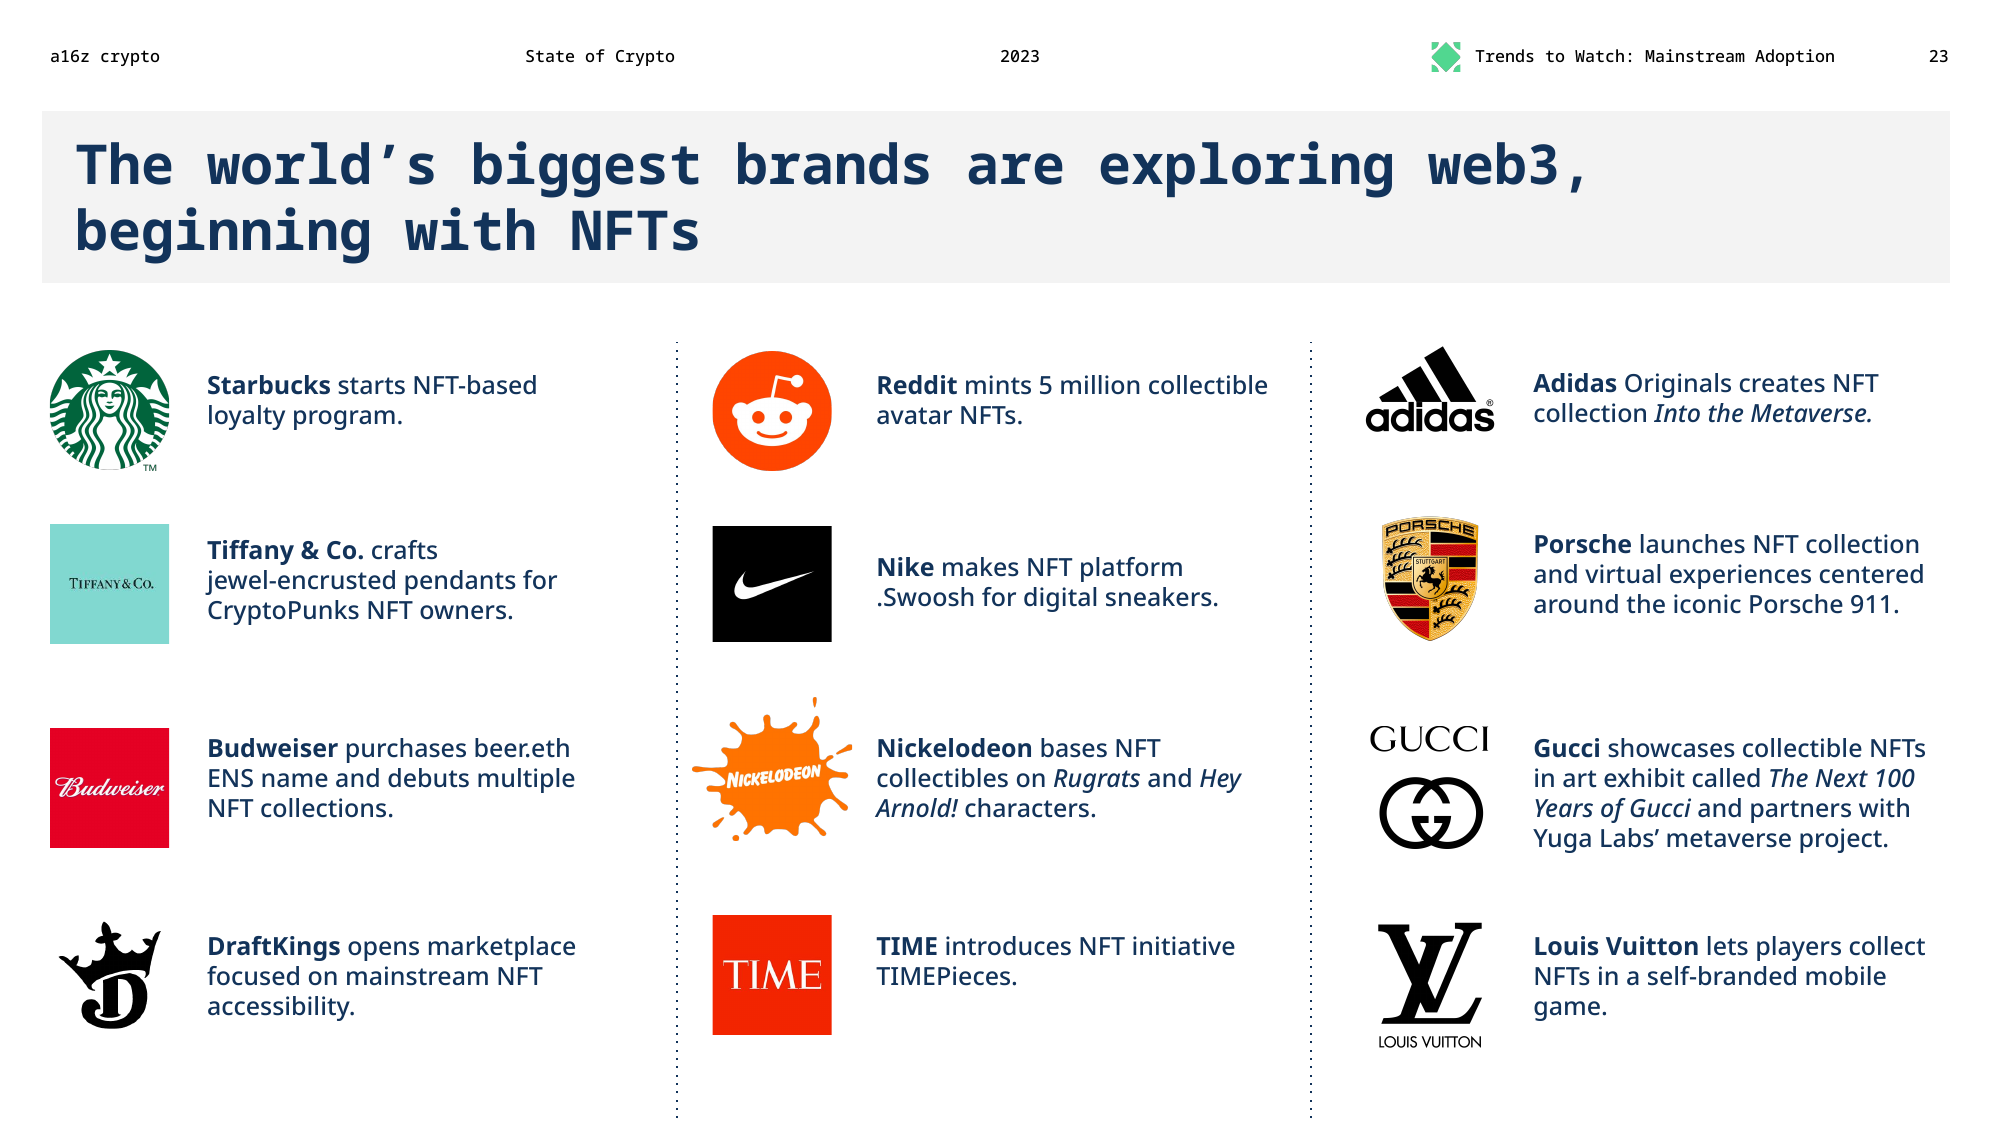
There's really nothing like "Tiffany's sells $50,000 gold, gemstone, and diamond pendants (sorry, 'NFTiffs') to people who already own an NFT that costs more than $100,000" to drive home the mass appeal of brands' exploration of NFTs.

Other markers of success are apparently:
Budweiser, whose "Budverse Live Scoreboard" NFTs haven't traded hands in months, but last traded at around $8 — down from the original mint price of $100.21 Their "Budverse Cans Heritage Edition" NFTs have more trading activity, and are selling at around $250 — half of the original $500 mint price.22
DraftKings, who are facing a class action lawsuit led by a plaintiff who lost over $14,000 trading NFTs that lost value23
Reddit, who bent over backwards to avoid even admitting the things they were selling were NFTs
Time, whose featured NFT collection at the moment is a collaboration with alternative medicine figure Deepak Chopra. They minted for 0.077 ETH (then around $120). Two of them have changed hands in the last month, for 0.01 ETH (~$20). Time's other collections are similarly lethargic.
Porsche, who fumbled its NFT launch so badly they earned a spot on Web3 is Going Just Great
Gucci, whose Next 100 Years of Gucci collection mentioned here has sold only 30 of the 68 available NFTs thus far, despite launching ten months ago
Web3 gaming is going just great
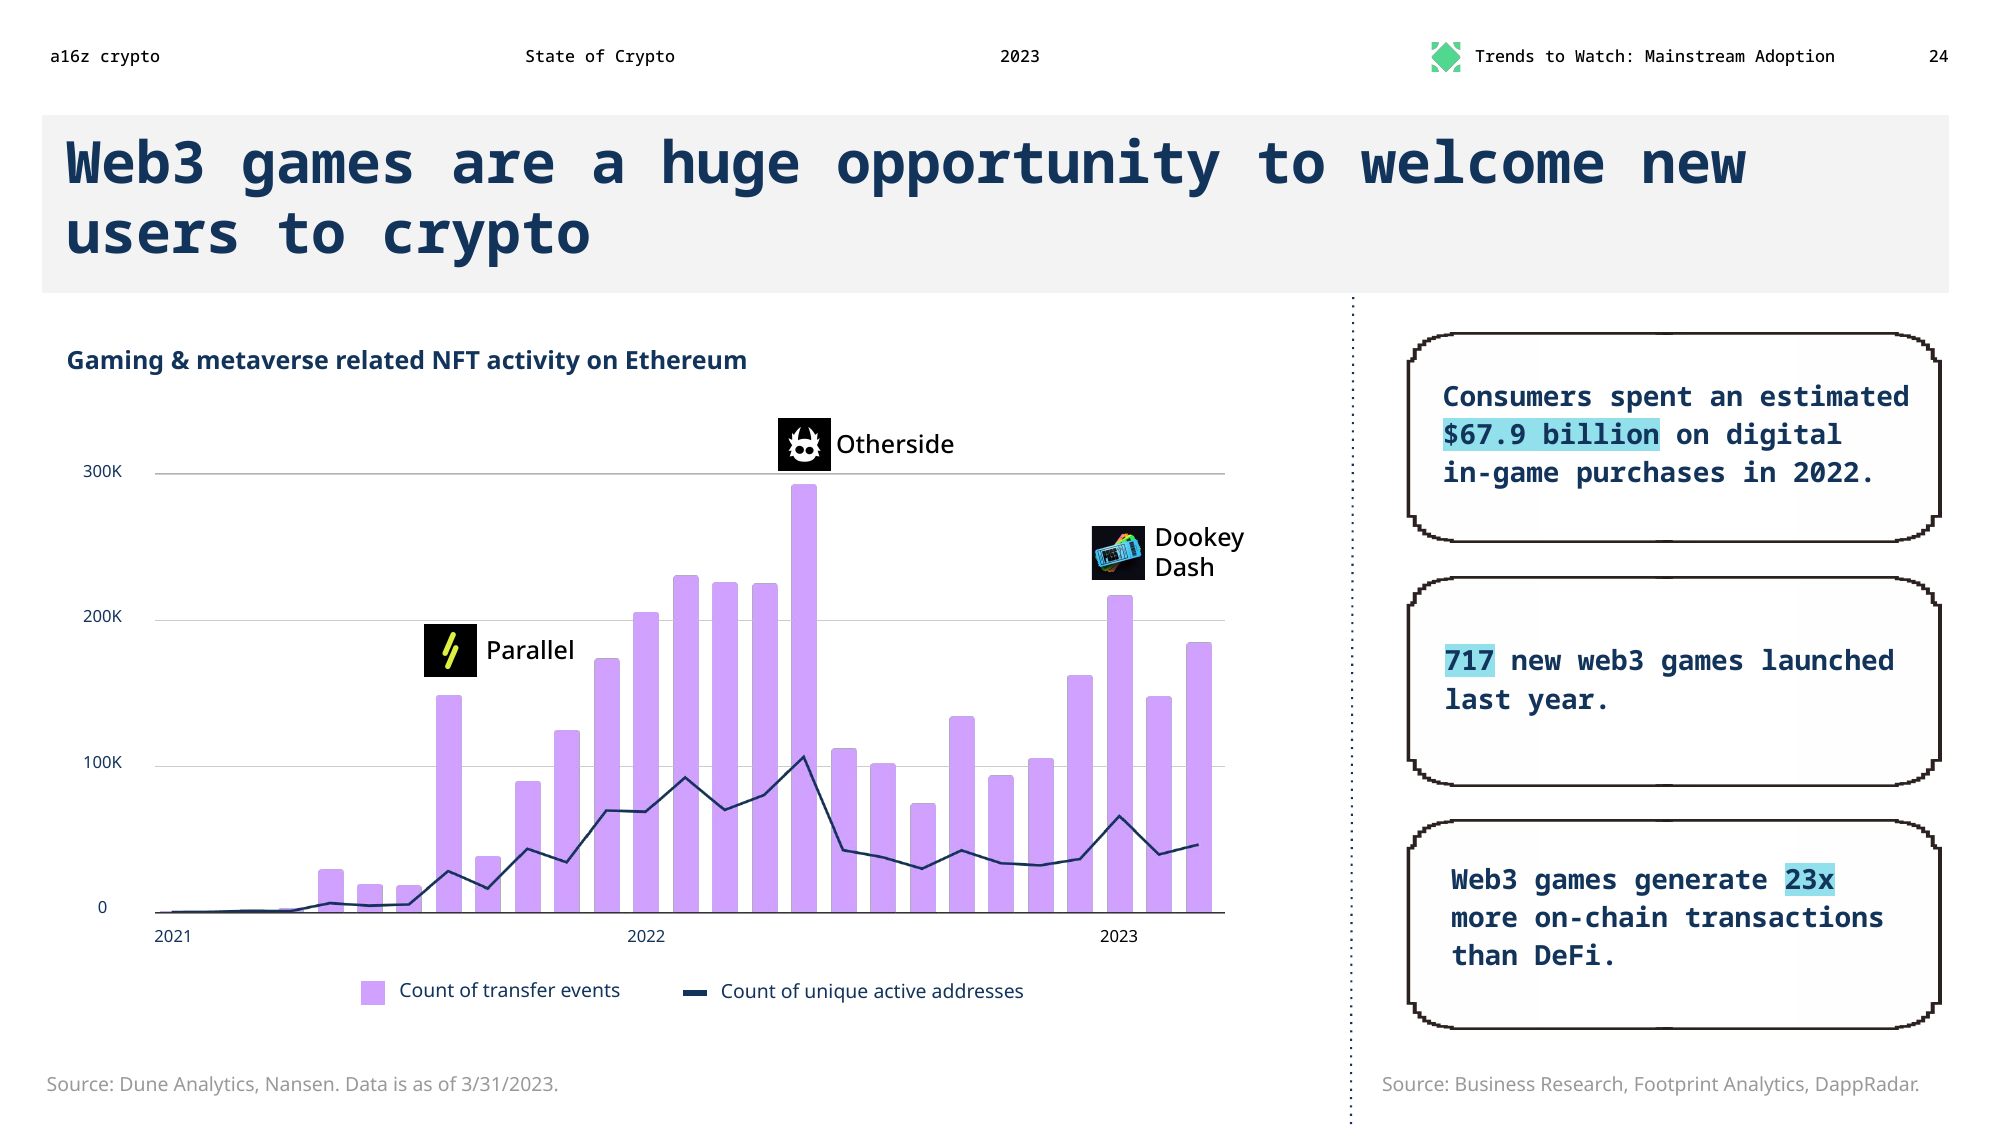
A16z is quick to talk up Yuga Labs (the creators of Bored Ape NFTs, who also created the Bored Ape-related Otherside and Dookey Dash — yes, really — games mentioned in this slide).
A16z has been a lot quieter lately about their once-flagship web3 game, Axie Infinity, launched by the a16z-backed Sky Mavis. It might have something to do with the fact that a March 2022 hack of Axie Infinity topped the 2022 hack leaderboard when North Korea-linked hackers stole $625 million from the game's blockchain bridge. Or maybe it's just that its whole model turned out to be economically unsustainable, and it's a little awkward to have to explain that the whole thing turned into digital sharecropping by the end.
Instead of waxing poetic about how Axie would bring "economic freedom" to "everyday people" as they were in 2021,24 a16z is now stuck arguing that Dookey Dash is a huge opportunity.

DAOs can pay taxes now
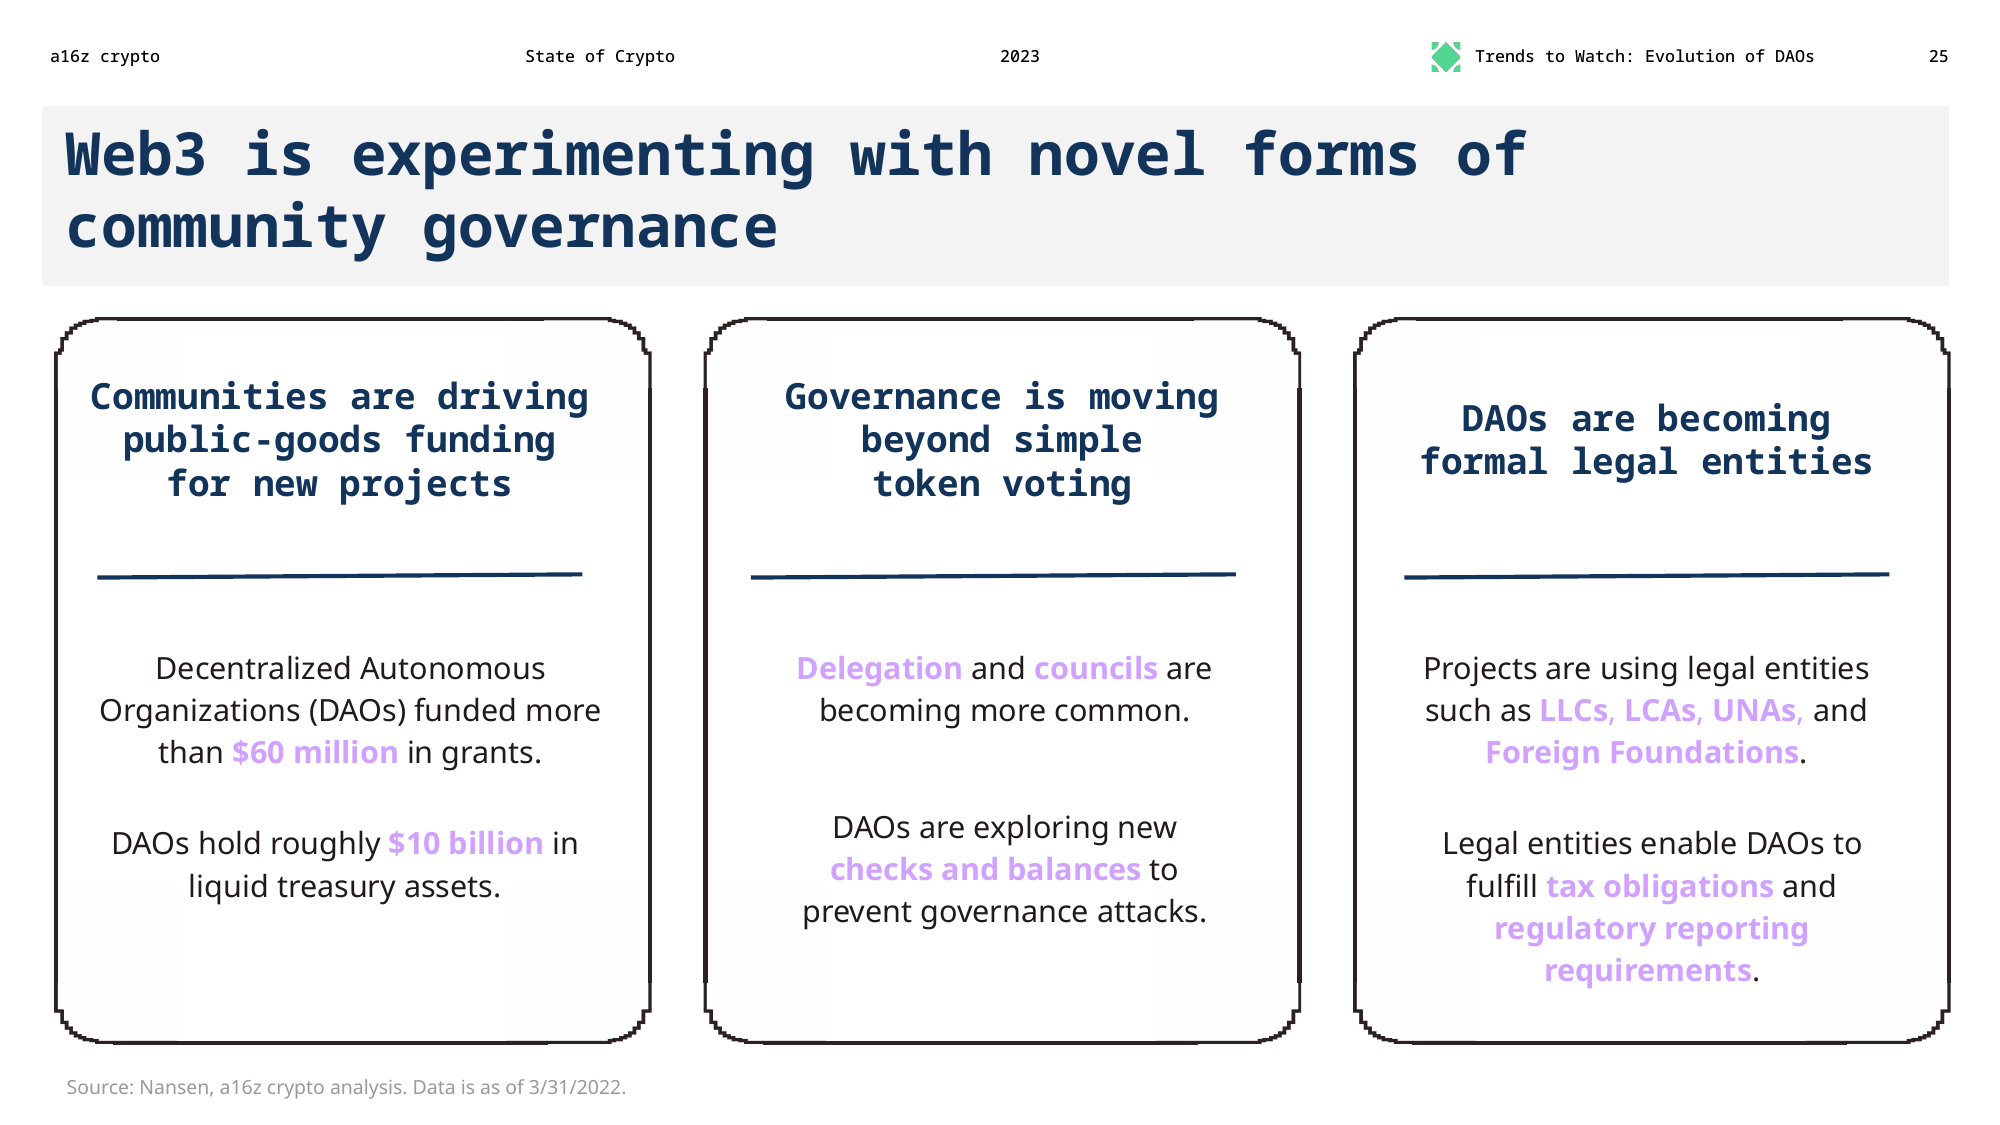
It might be a signal of just how poorly decentralized autonomous organizations (DAOs) have been going that one of the best things a16z could come up with in this slide is "well, they've figured out how to form an LLC and pay taxes".
Meanwhile, other DAOs are learning the hard way that you can't just go "but we're decentralized!" when the CFTC comes after you for trying to dodge commodities regulations, and that the CFTC will absolutely find members of an unincorporated association liable.
Other DAOs are also going just great.
But the US keeps trying to keep us from innovating (in crime)
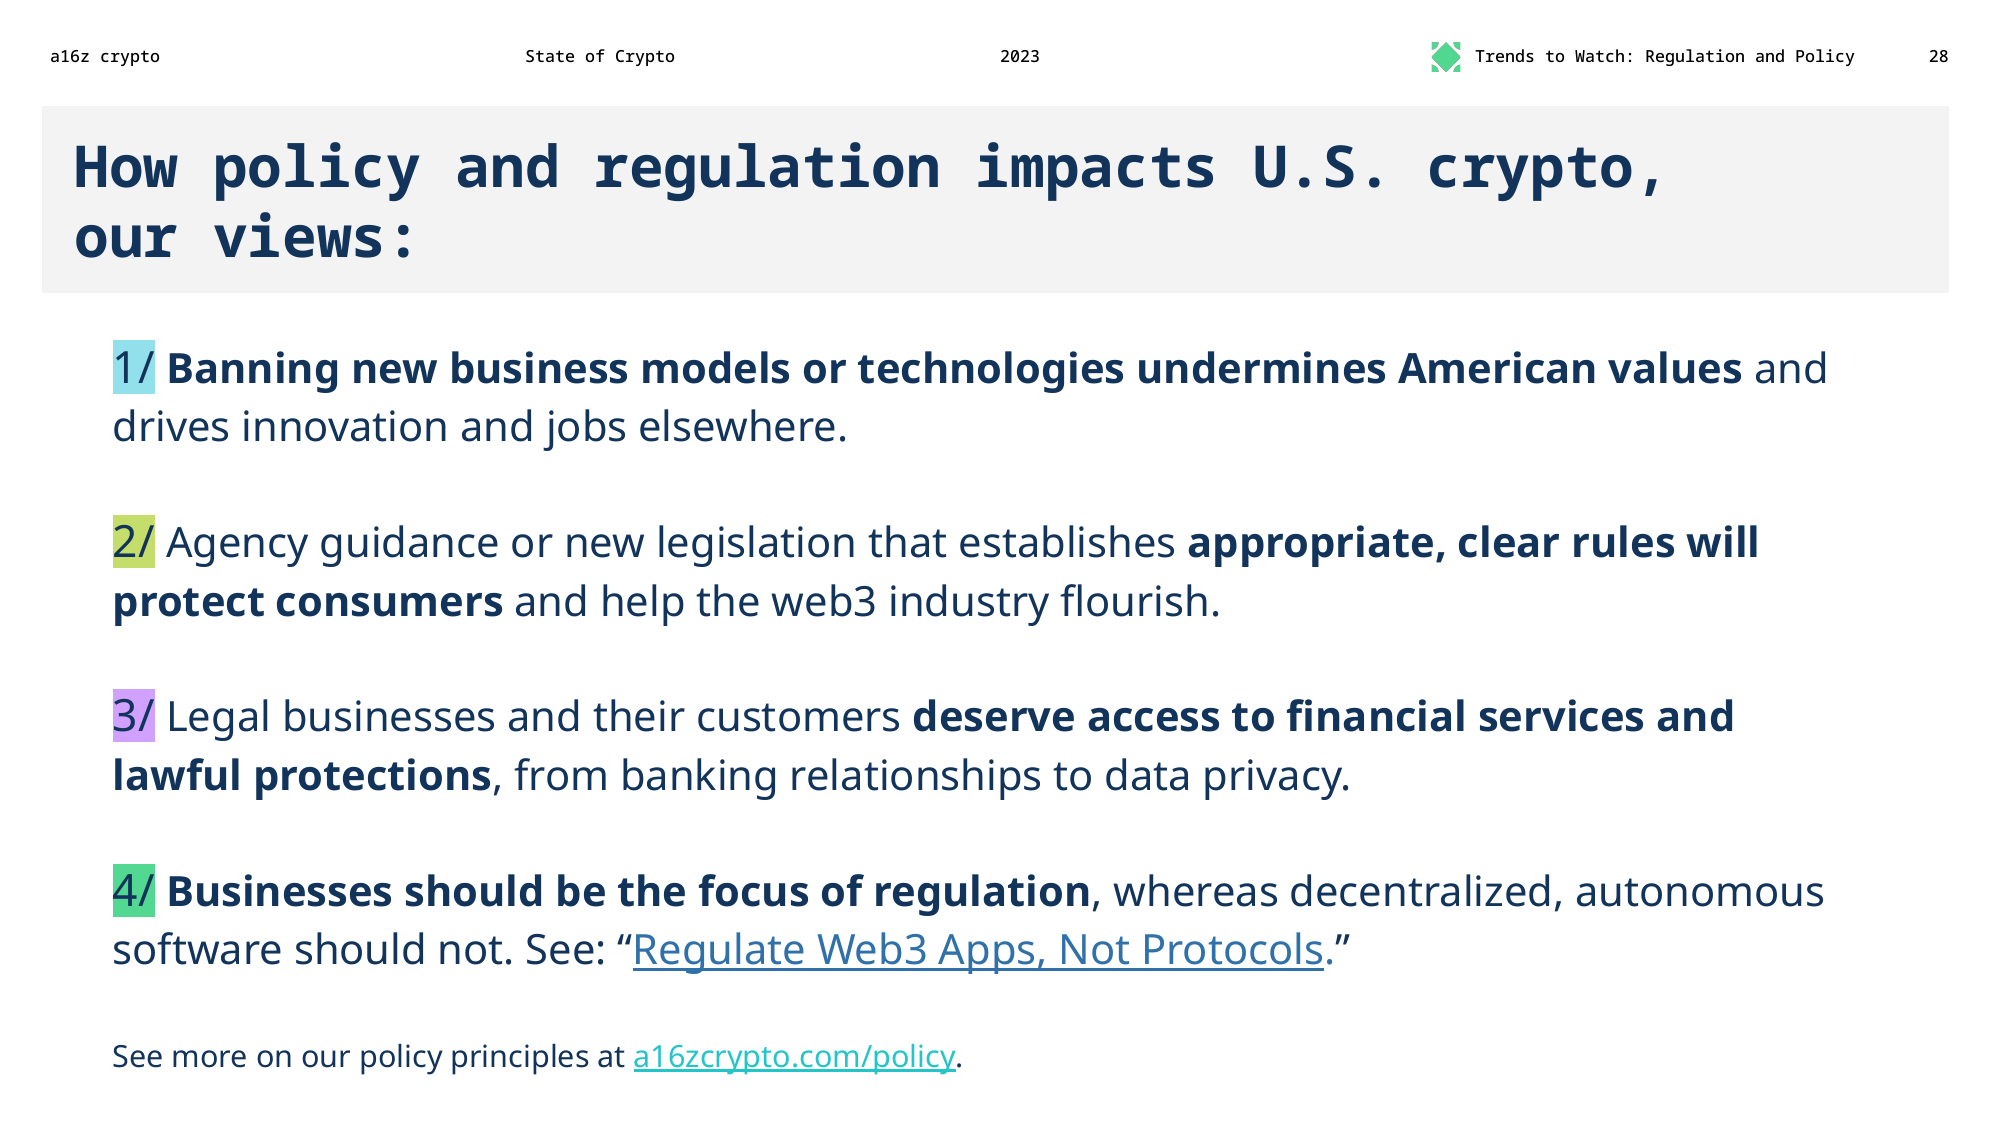
"Banning new business models or technologies undermines American values." This is why a16z is excited to announce they will be leading the seed round in the new firm, Ransomware4Cheap PyramidCo. Get in on the ground floor! Refer all your friends!
This is Matt Levine a while ago, on the "you're banning all our innovation" arguments from the crypto industry:
The position of Coinbase — and of the crypto industry more broadly — is "look, SEC, if you want to have a flourishing system of legally compliant, safe, trustworthy crypto assets, you will need to work with us a little bit to write new rules," and the position of the SEC is "no, we don't want that, we want all of you to go away forever." If Bernie Madoff came to the SEC and said "if you want a higher class of more trustworthy Ponzi schemes, you will need to write a few new rules adapting the disclosure regime to Ponzi schemes," the SEC would have said "no we absolutely do not want that, we want much less Ponzi scheming, and we certainly do not want to give our approval to Ponzi schemes by writing rules for them." One gets the sense the attitude to crypto is similar.25
Several other slides in this report also try to play to fears of declining American hegemony, with titles like "The U.S. is losing its lead in web3".
Don't look too closely at the charts
In multiple slides, a16z uses headlines that seem to have been written without actually looking at the chart that accompanies them.
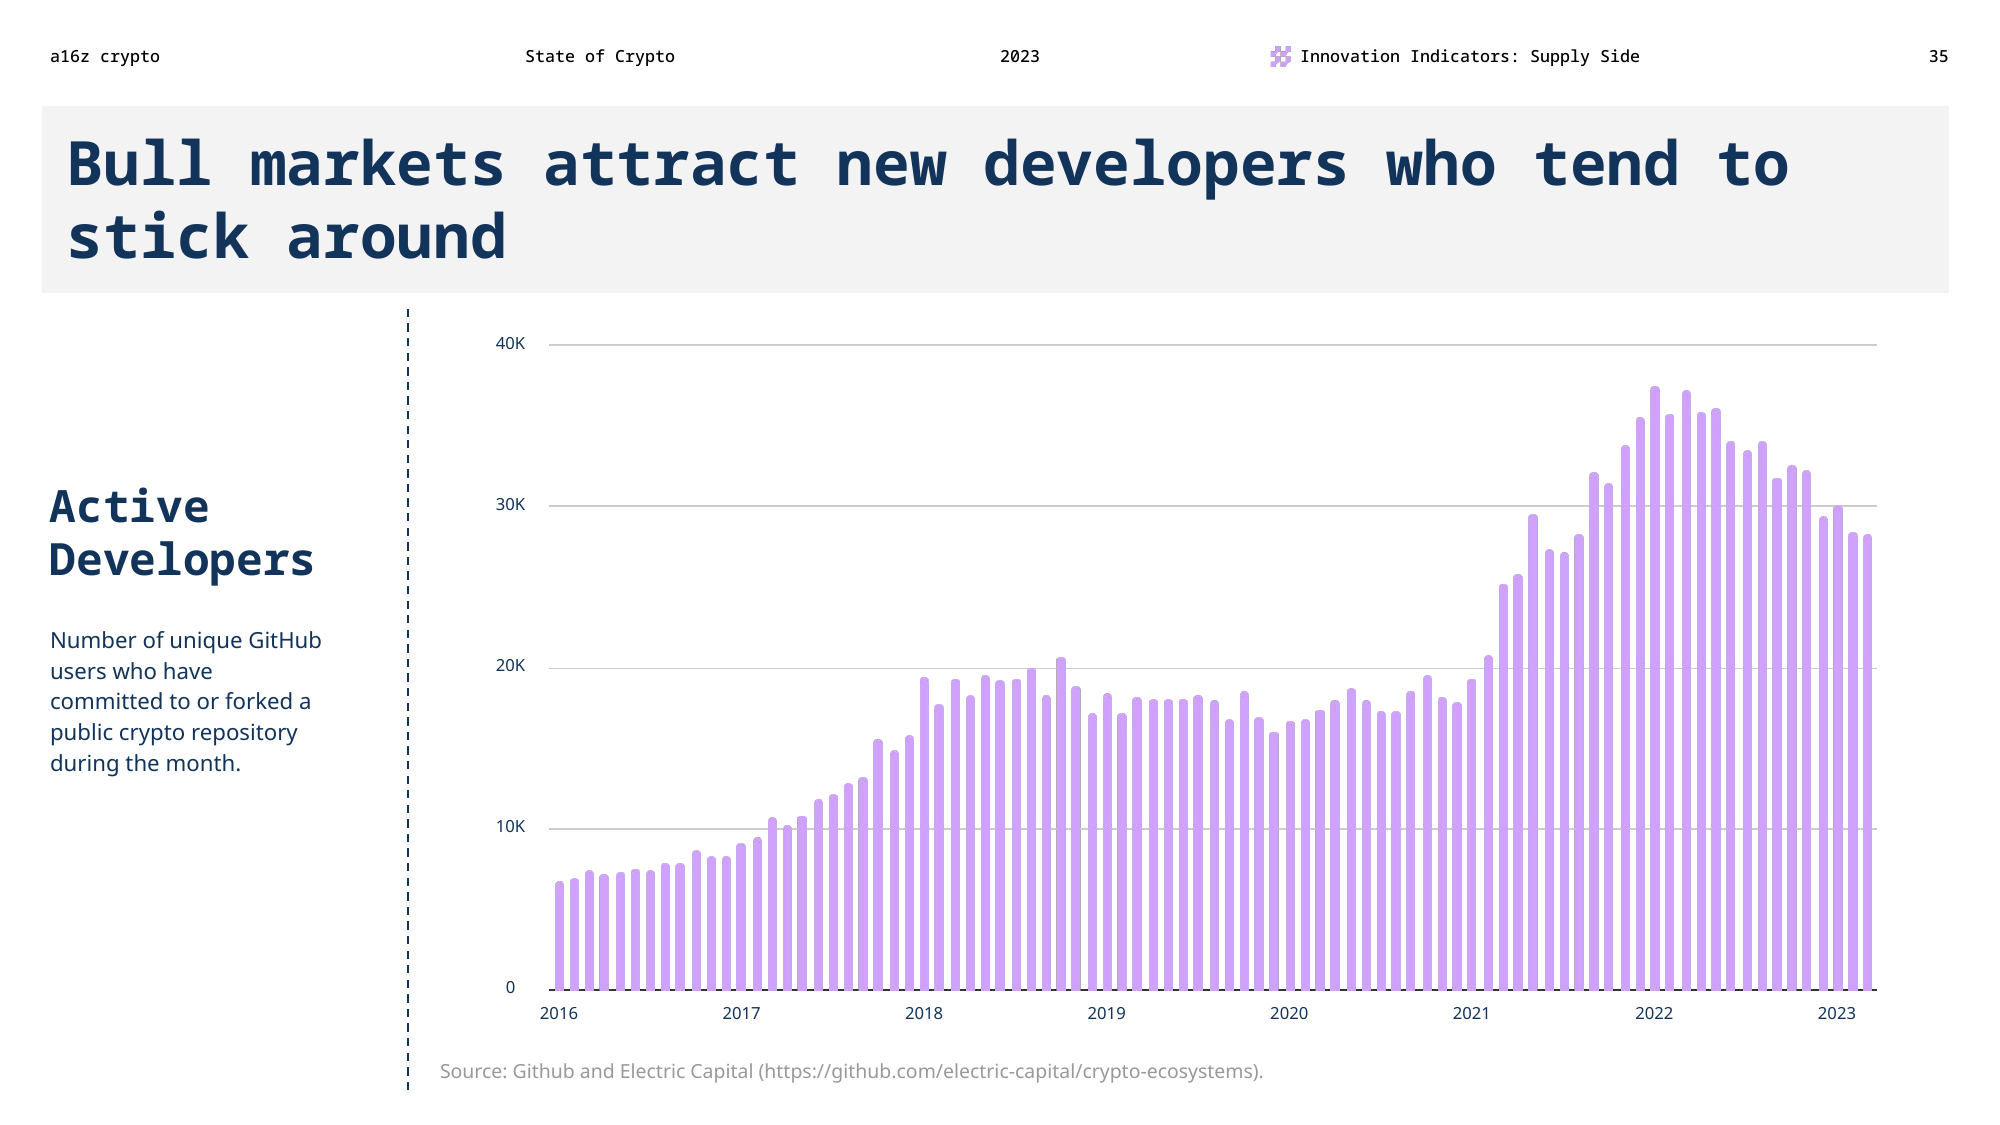
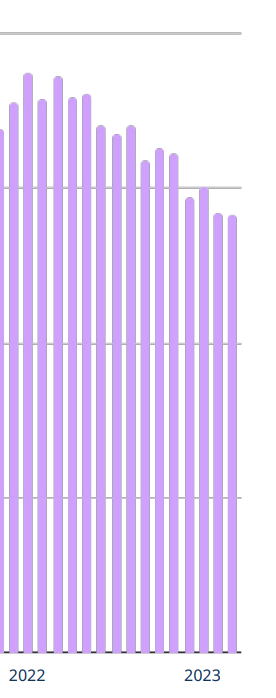
"Sticking around" apparently means a roughly 25% decrease in this metric since early 2022.
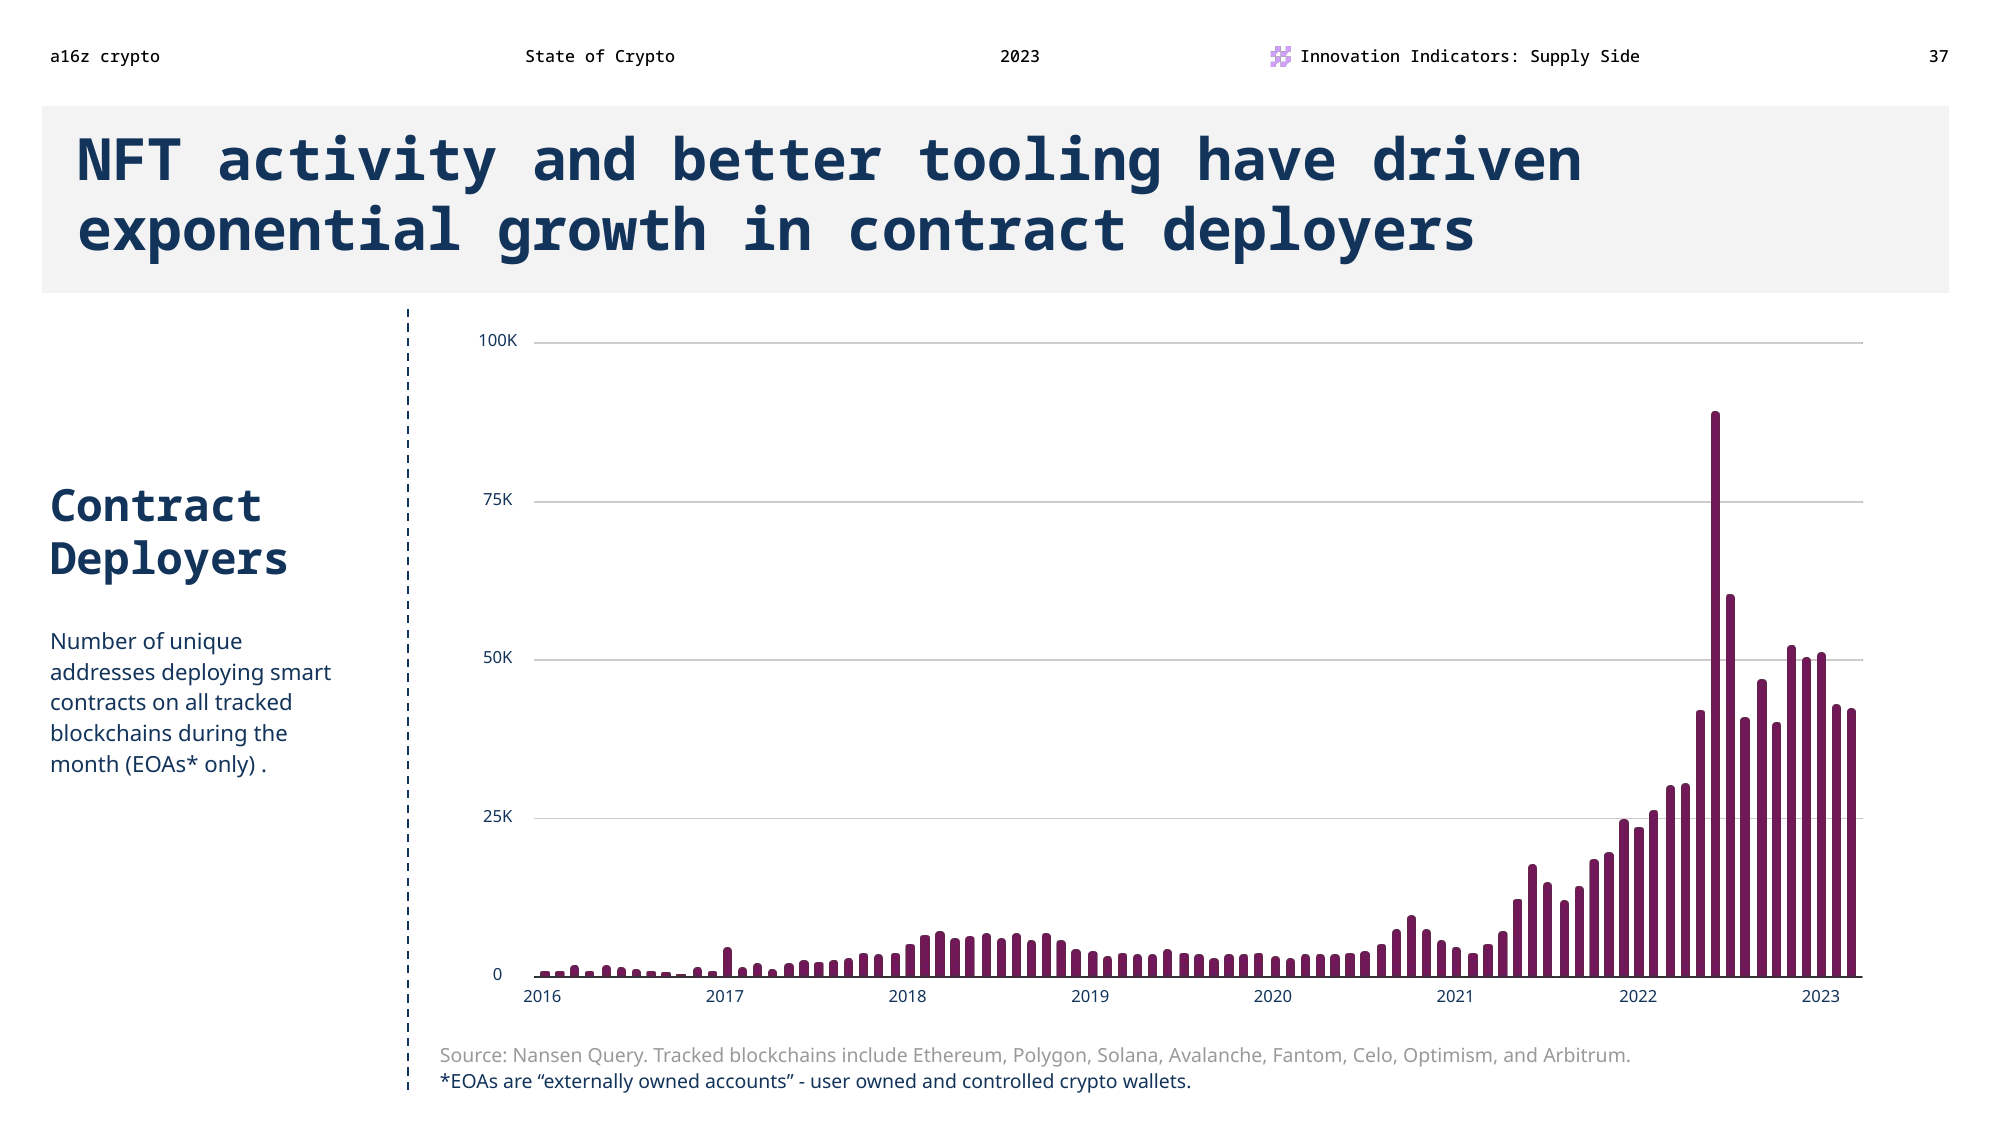
The headline-writer later describes a decidedly not exponential-looking chart as "exponential growth", seemingly allowing their eyes to follow an outlier in their dataset and ignoring the subsequent data points.
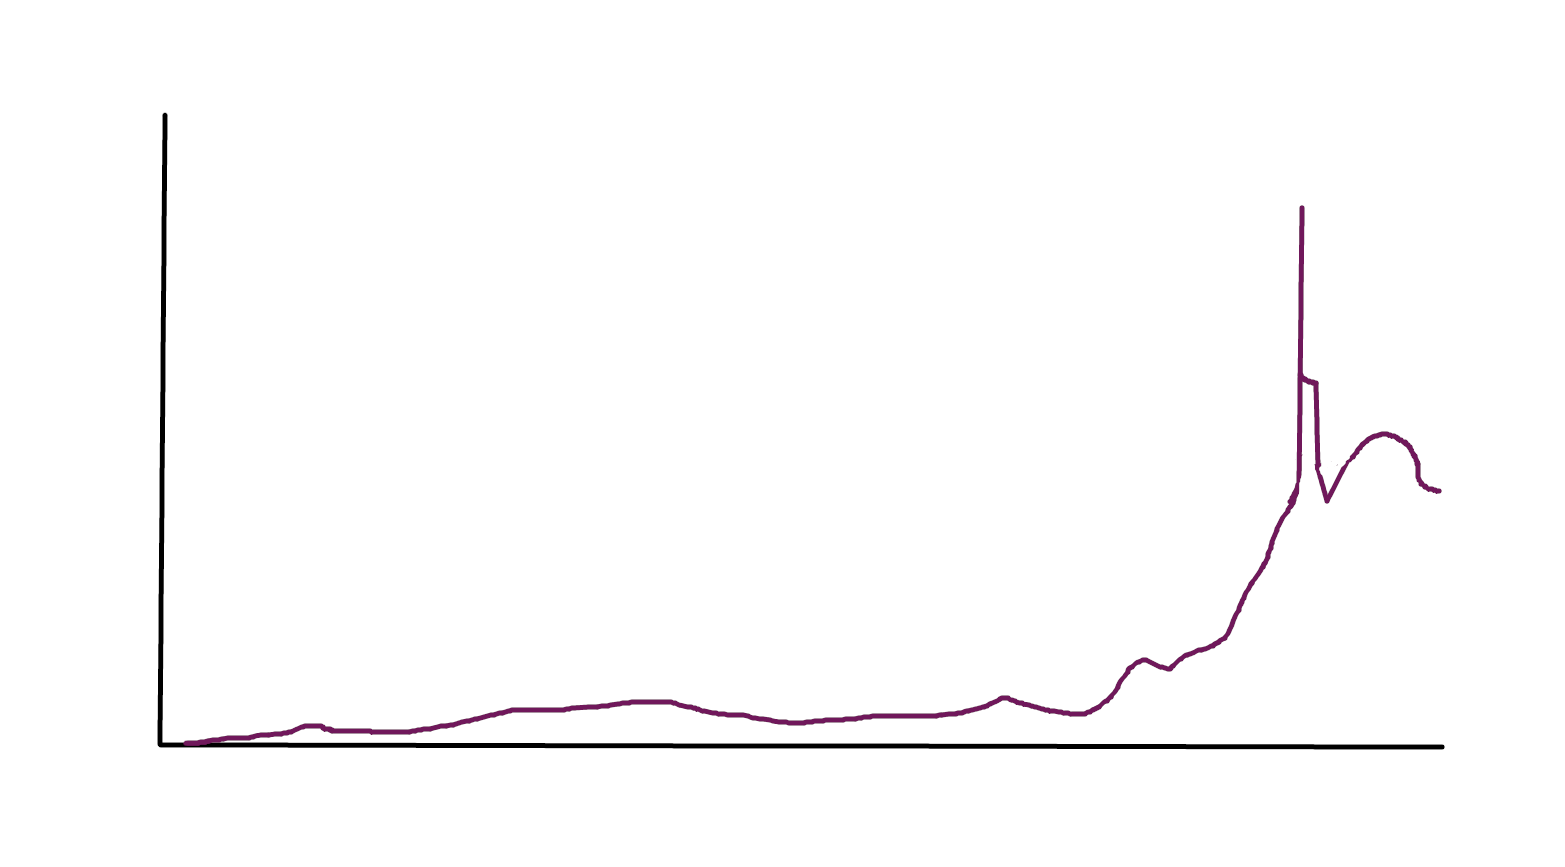
Perhaps in the alternate-universe a16z data science department, exponential growth takes this shape:
a16z also assumes that the raw number of unique addresses deploying smart contracts is a meaningful metric by which to estimate crypto's growth without any clear argument as to why that would be the case — a type of assumption that's repeated frequently throughout the slide deck. This leaves one with the very distinct feeling that they found charts that looked like they were still going (roughly) up even after crypto prices declined, and worked backwards to make the argument that those metrics were the most meaningful indicators of crypto's growth.
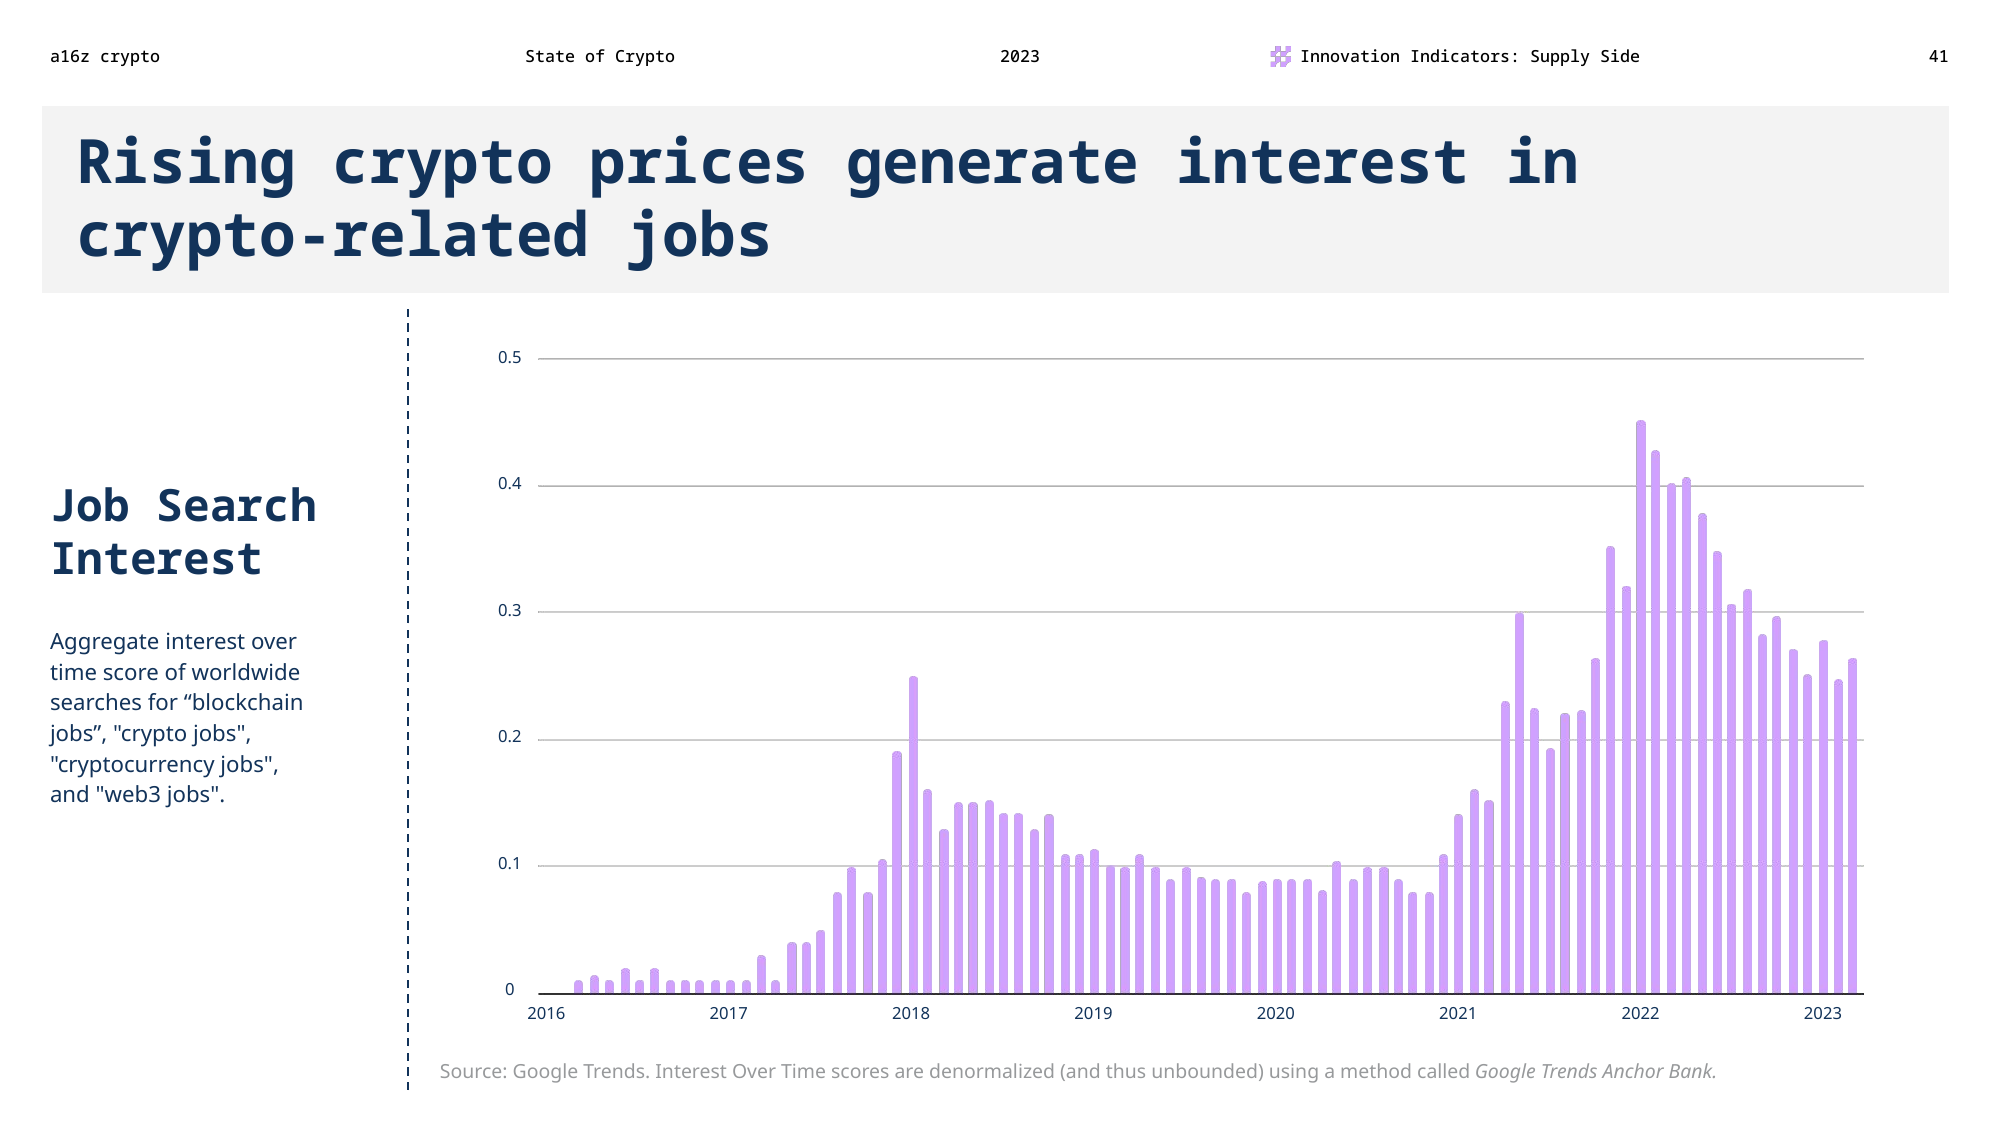
The headline here is more accurate, at least, as is the converse: falling crypto prices have apparently resulted in falling interest in crypto jobs. Another takeaway from this chart that didn't make the headline is that interest in crypto-related jobs is down more than 40% since the beginning of 2022.
All publicity is good publicity
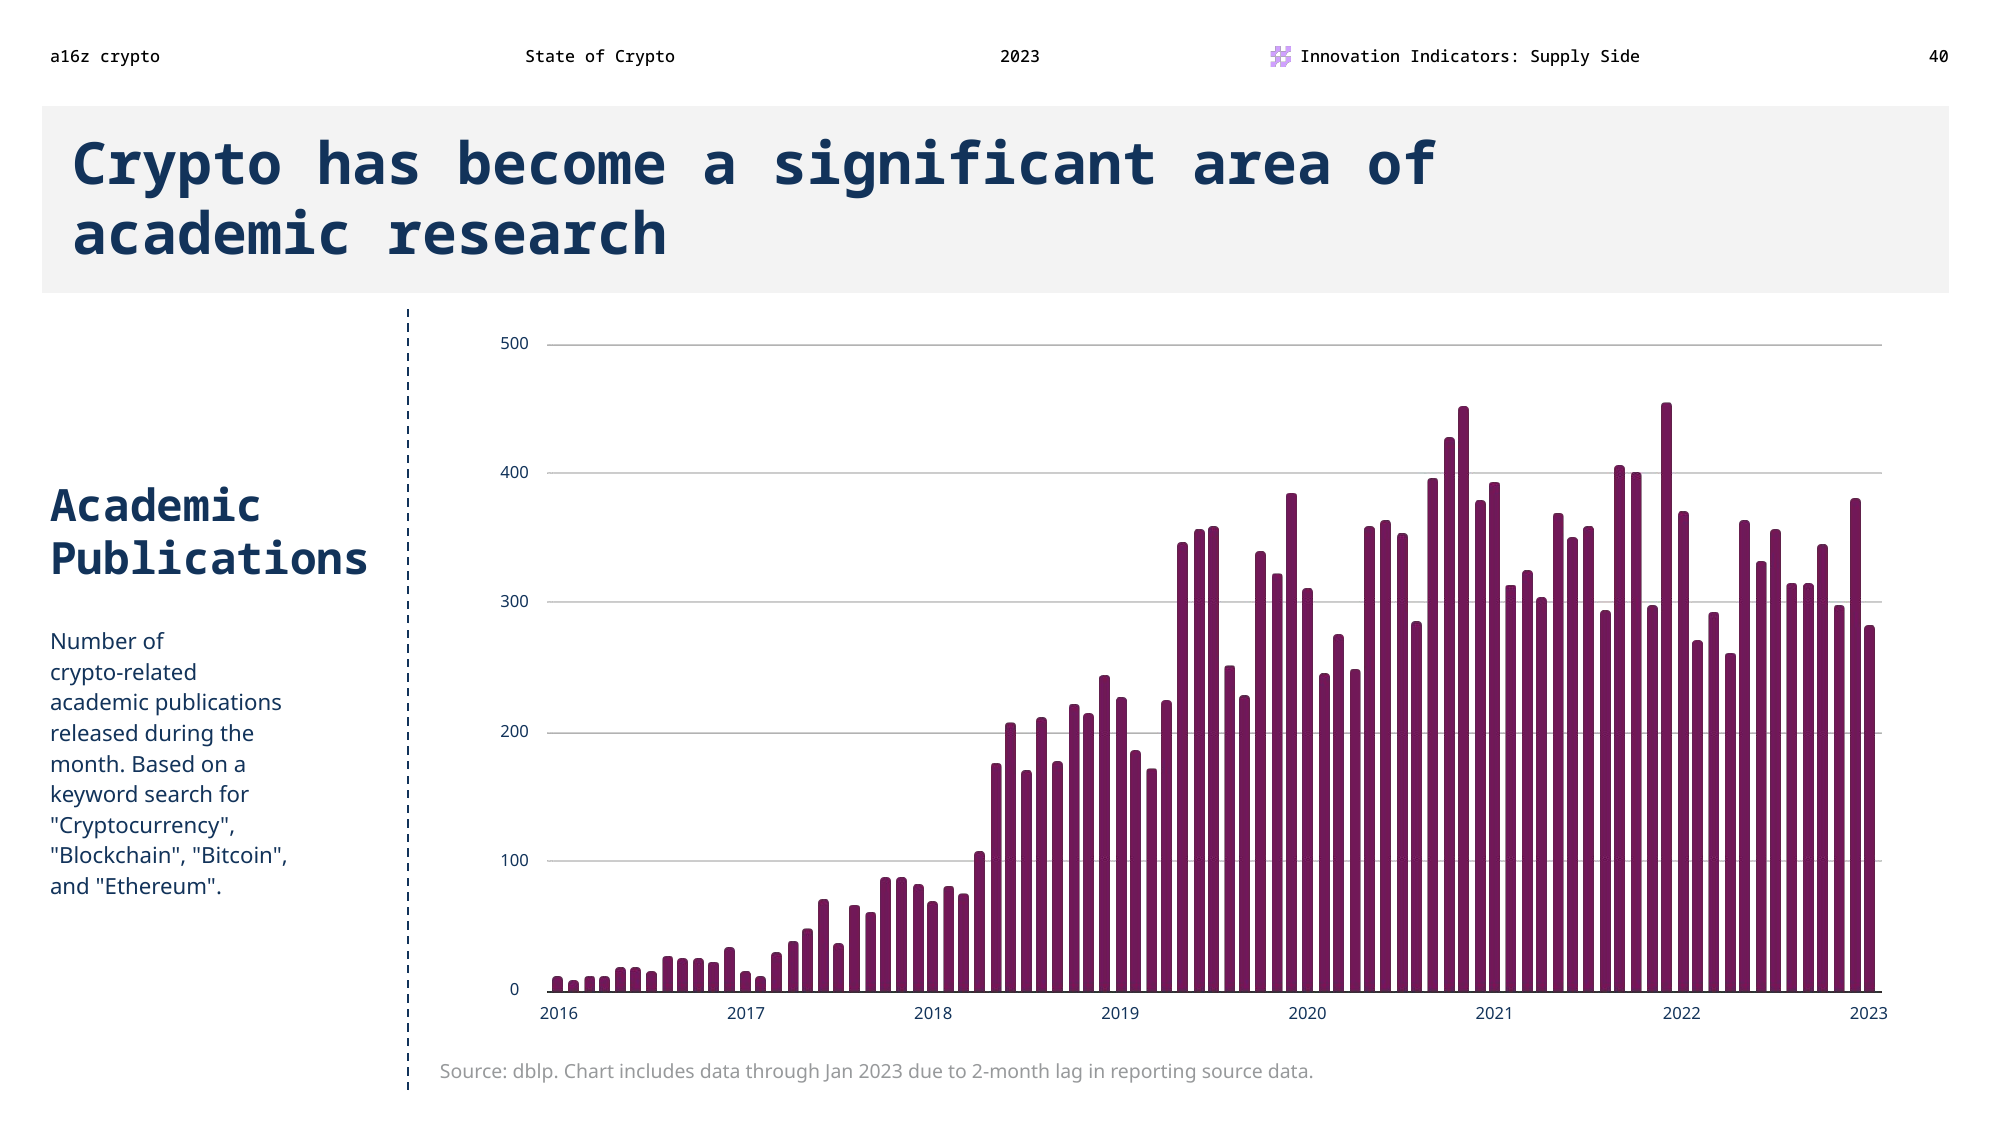
Like with Twitter mentions, a16z decides that mere mention of "cryptocurrency" or "blockchain" in an academic paper is good news for crypto. One wonders what they would think of papers studying pyramid schemes or other predatory financial products. "Time to invest!"
There has been a lot of excellent critical research of the industry over the past few years. To name a few academic papers that certainly are included in the numbers represented on this graph based on the naive keyword search, but are by no means predicting a flourishing future for crypto:
- "DeFi: Shadow Banking 2.0?" by Hilary Allen in the William & Mary Law Review (forthcoming)
- "Blockchain Imperialism in the Pacific" by Olivier Jutel in Big Data & Society
- "Old frauds with a new sauce: digital assets and space transition" by Daniel Dupuis et al. in the Journal of Financial Crime
Correlation equals causation
Several slides in the report make causative links between a16z's chosen metrics and other shifts in the crypto ecosystem, such as: "Active addresses are growing steadily as web3 adoption increases", "Blockchain transactions exploded as scaling technologies reduced transaction fees", and "Fees increase as demand rises, but decrease as scaling tech supplies more blockspace".26
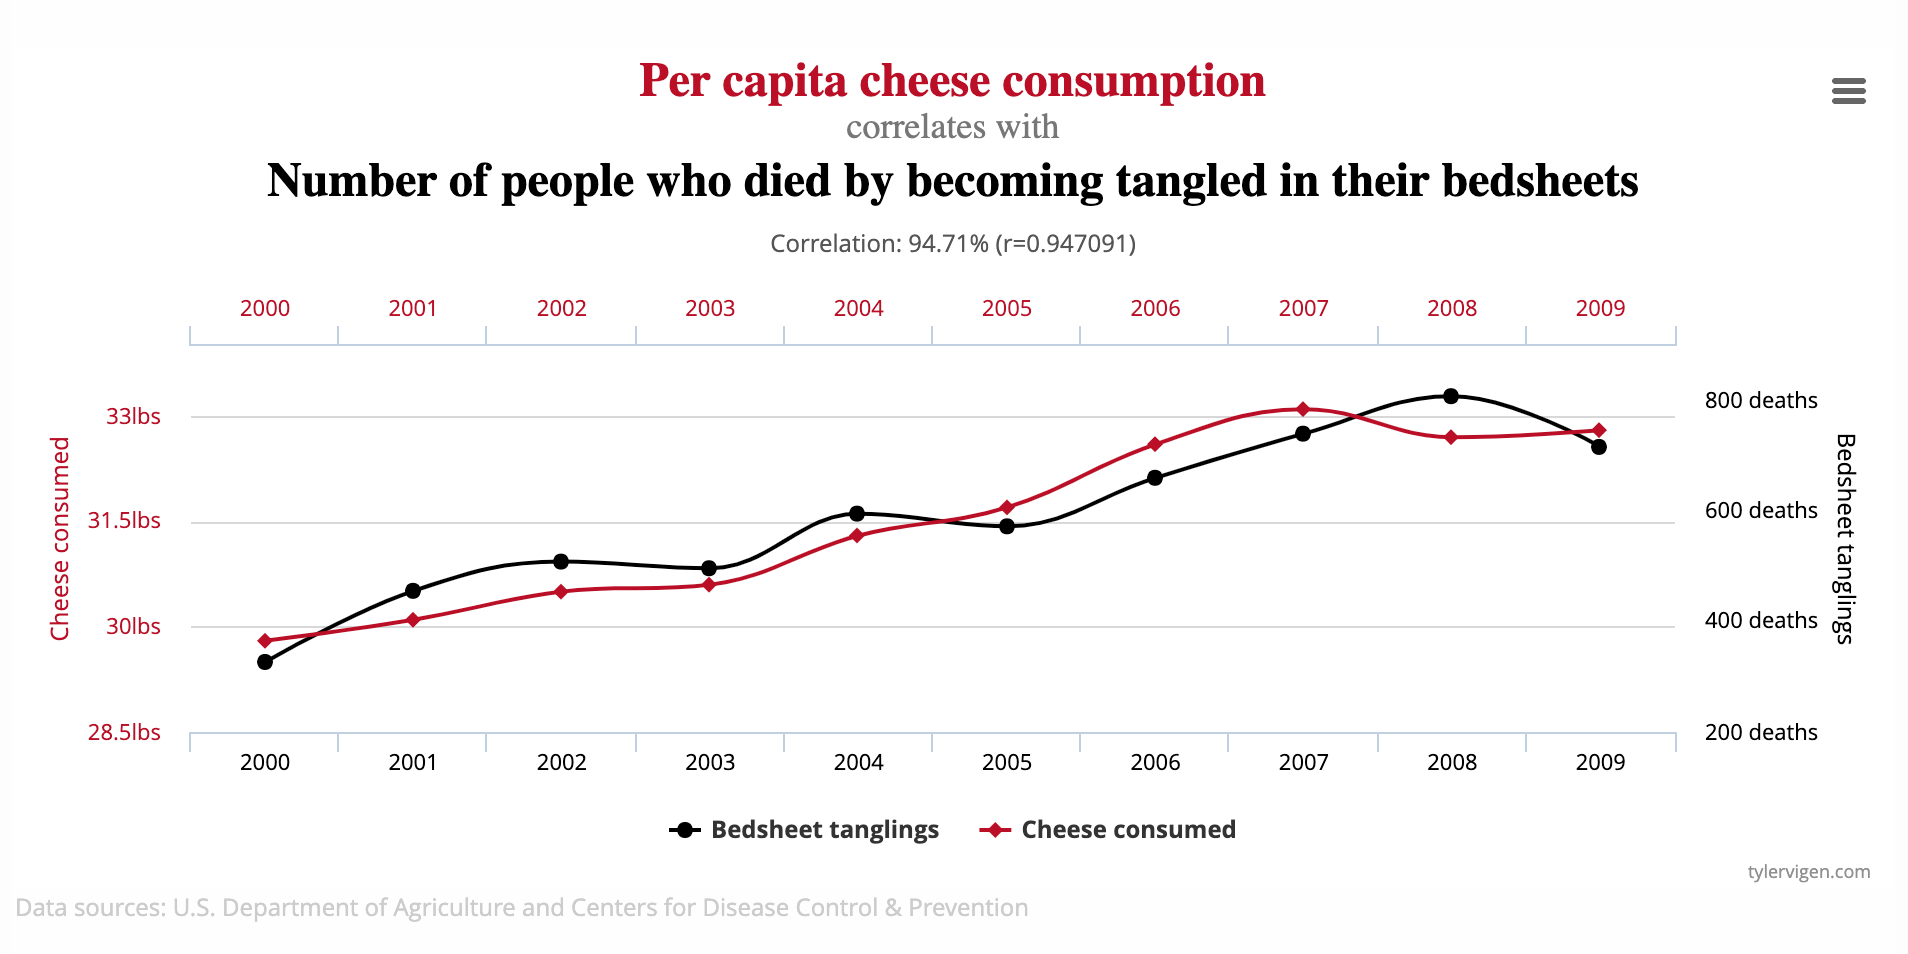
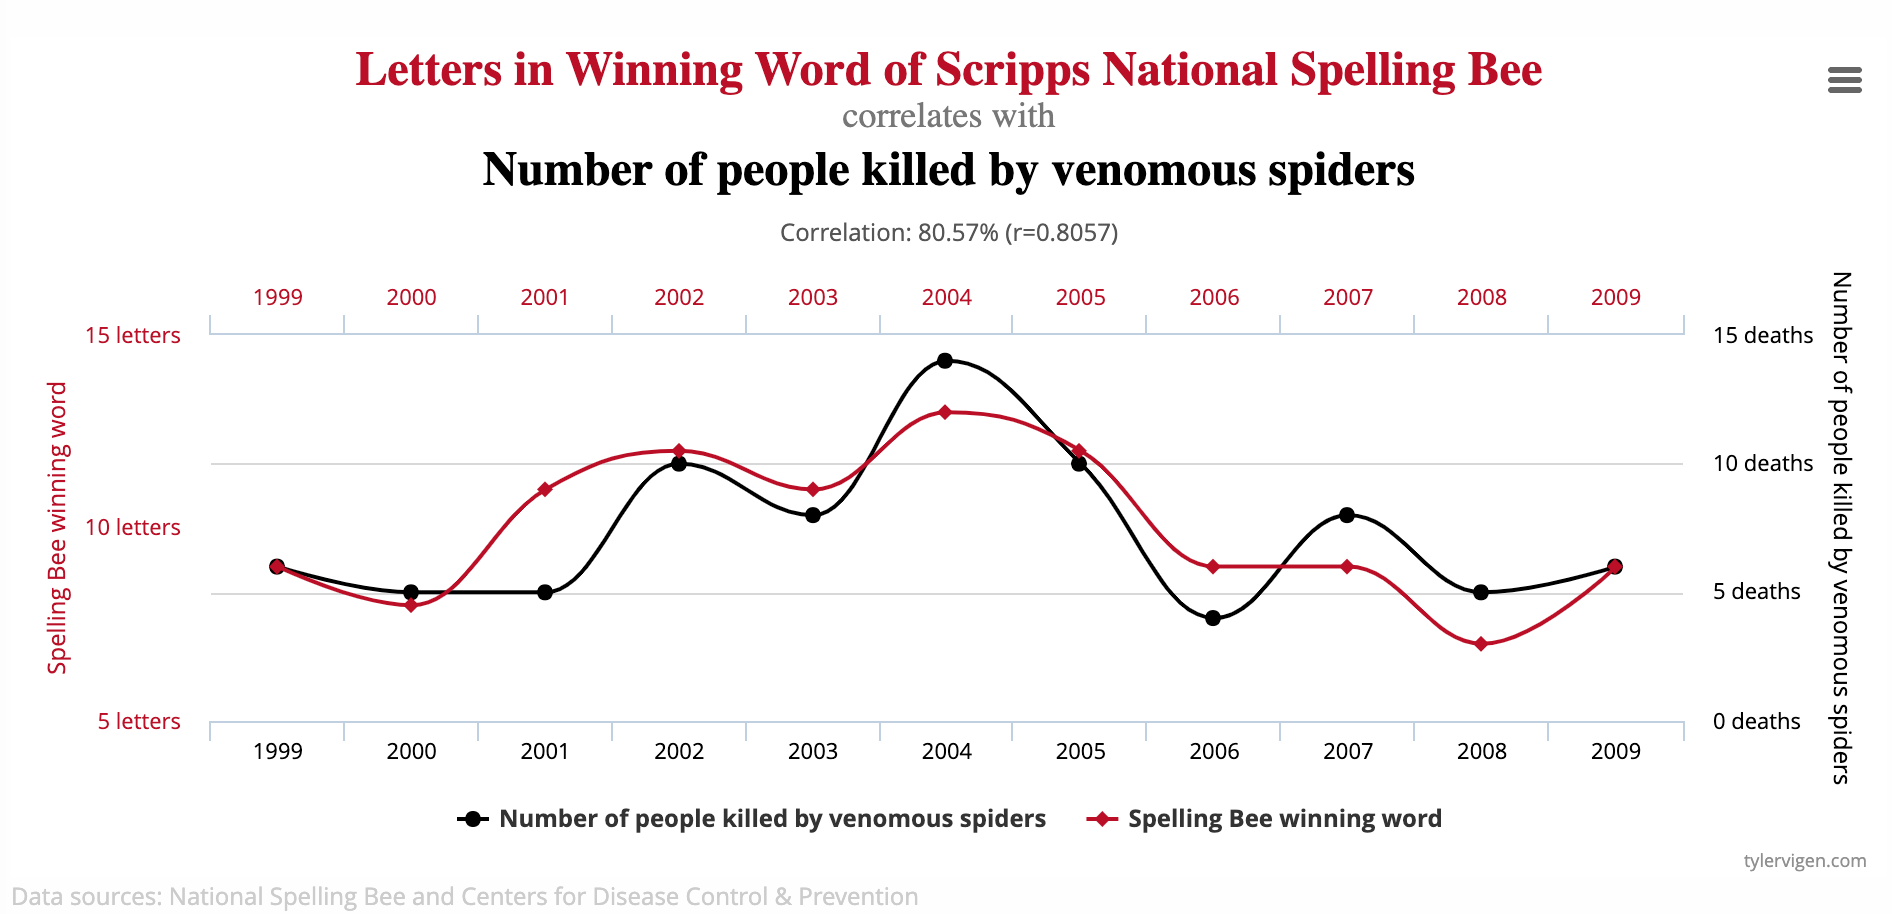
None of the charts actually show any data about the shifts that supposedly spurred the patterns in the associated metrics, failing to show even that there is correlation much less a causal link. "Trust me bro", I guess. Since that's the level of rigor that they're going with, I would like to suggest a few more additions to the slide deck (which are actually much more diligent about demonstrating correlation than a16z has chosen to be):
People aren't using mobile wallets anymore, and… this is good?
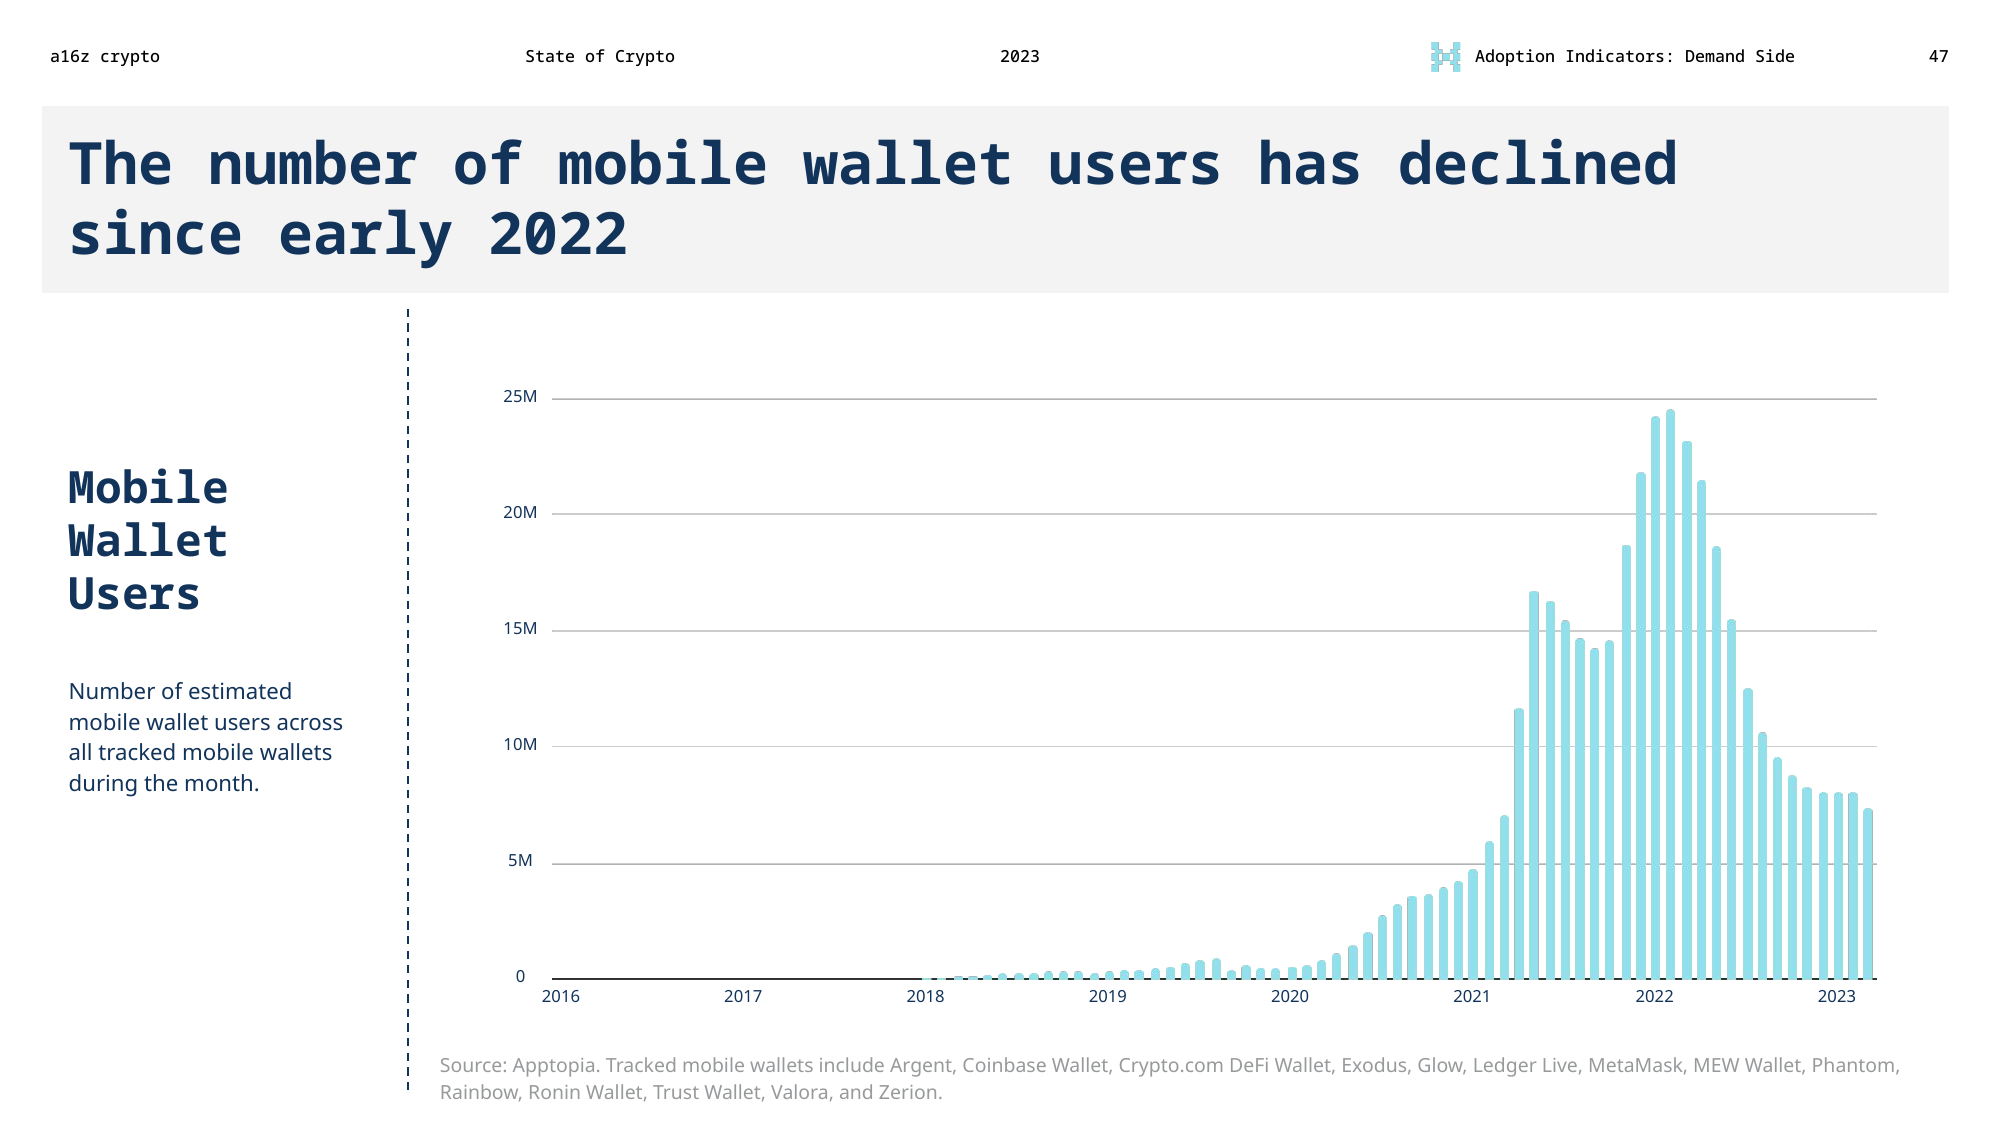
This is one of the few slides where a16z includes a chart and doesn't even try to explain how the information is somehow a promising sign for the crypto industry. Nowhere else in their other messaging around this report could I find any indicator for what conclusion we're meant to draw from this slide, but it seems hard to see it as showing anything but a massive dropoff (~70%) in active consumer engagement with crypto since the highs of 2022.
Futurecasting based on two months of data
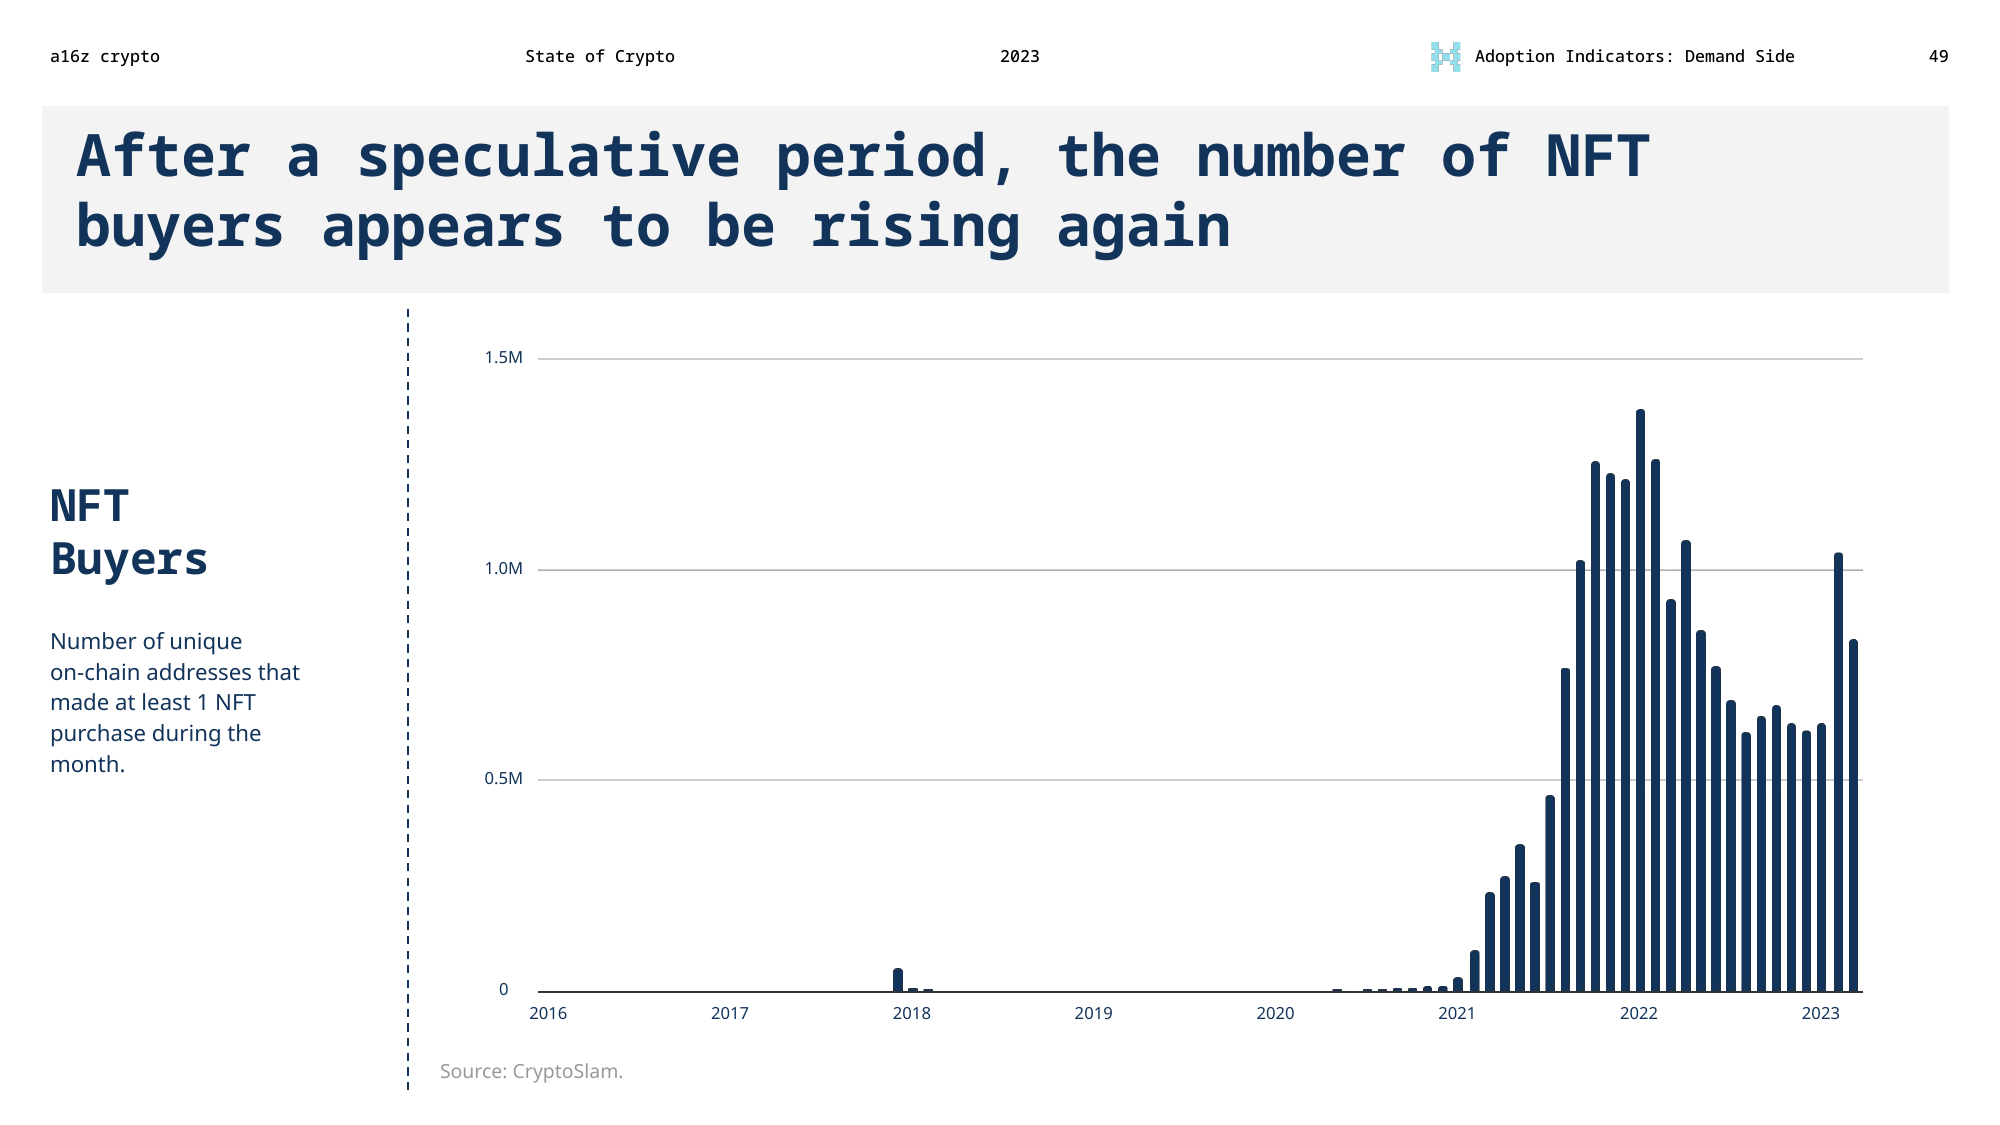
In this slide, a16z claims that "the number of NFT buyers appears to be rising again. This seems like a bold claim to make based on two months of data in 2023. Fortunately, they cite their sources, and so we can check to see if the trend has continued into April.
CryptoSlam plots their data more granularly, and also includes the number of unique sellers and total sales in USD:
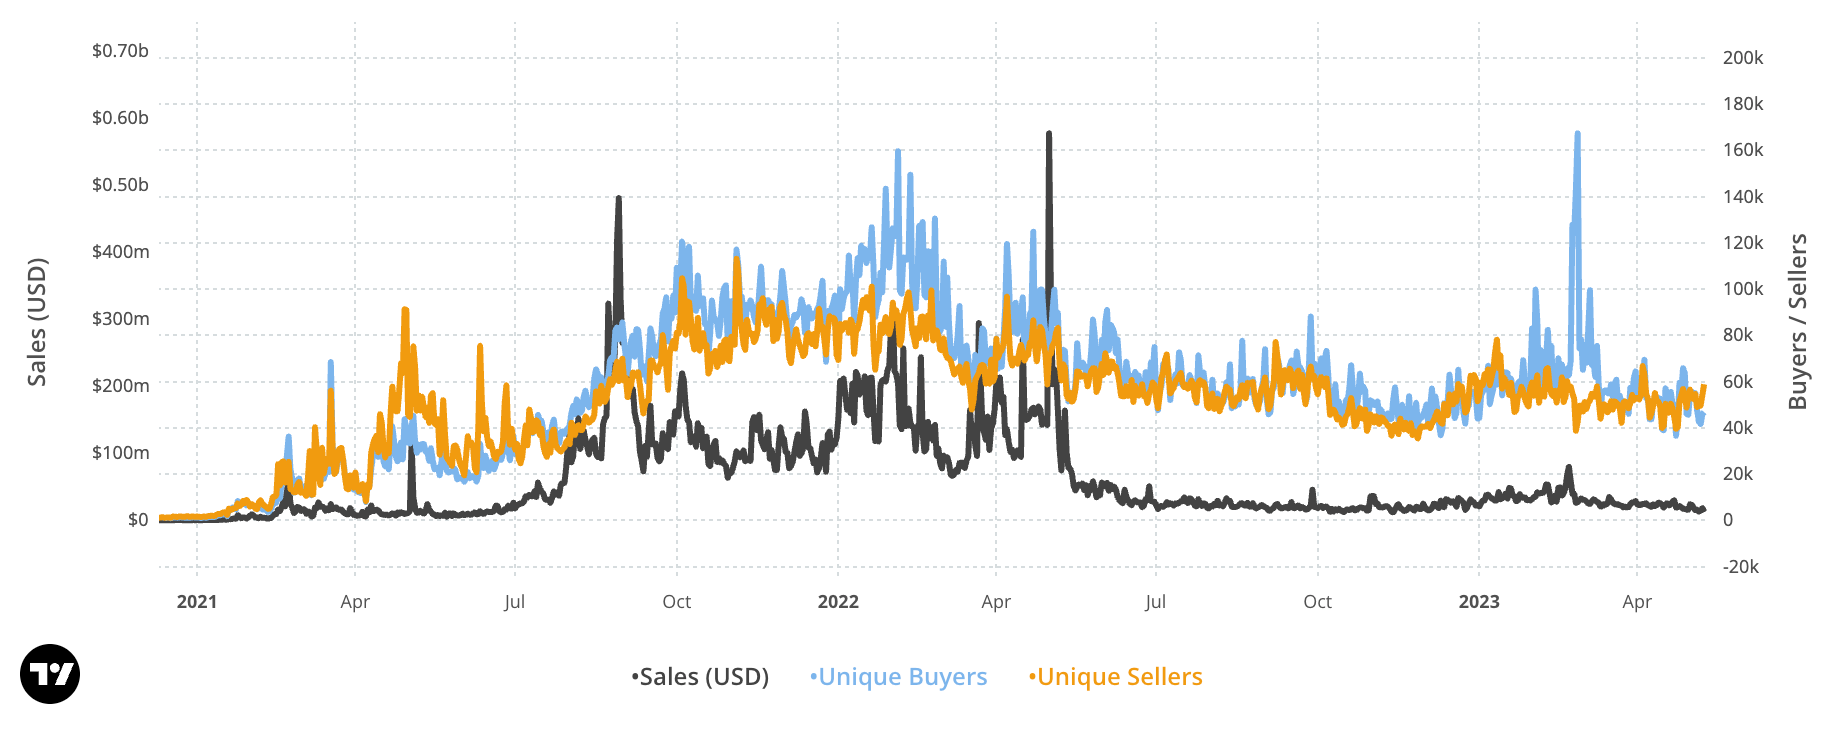
From this we can also note that while there was a clear spike in unique buyers of NFTs in February, the corresponding change in total sales was minimal — potentially an indicator of wash trading.
To look at how things have developed with an additional full month of data, I can use CryptoSlam's monthly rollup table to reproduce a16z's plot:
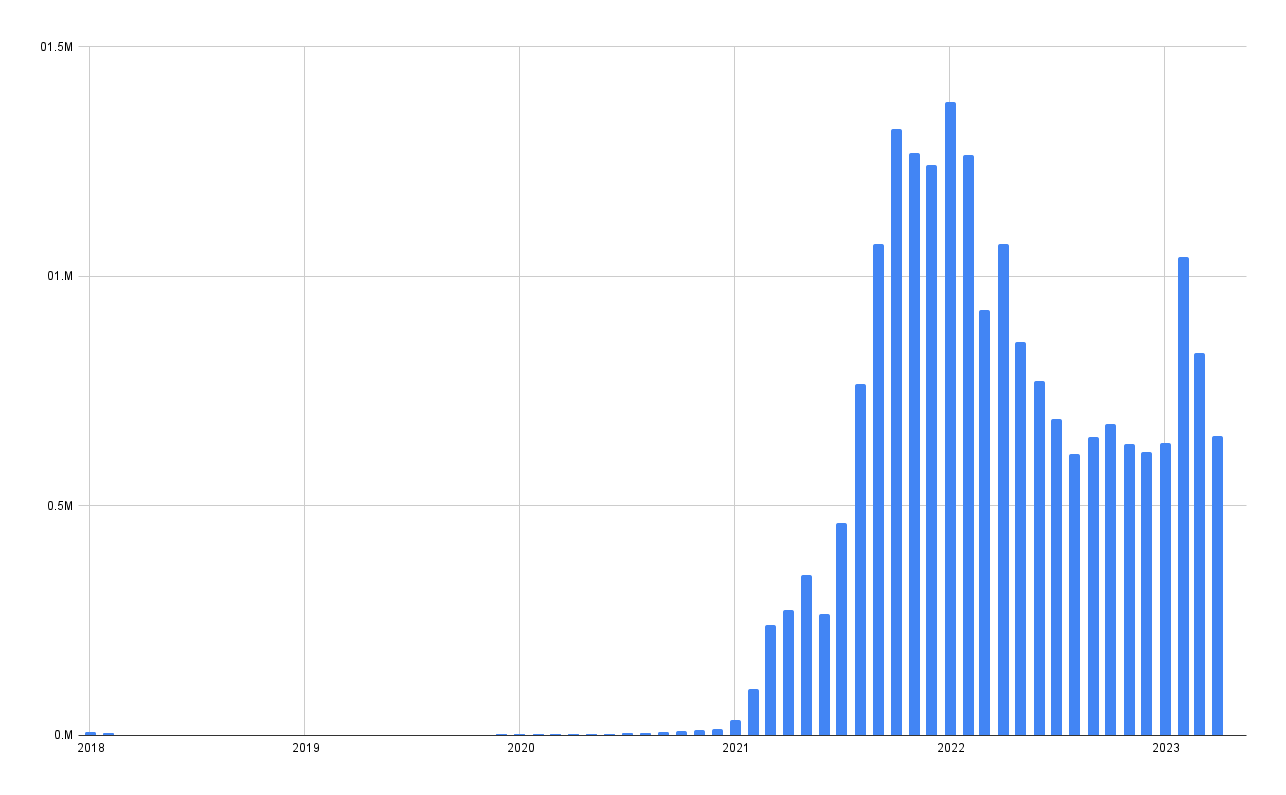
Just as it was too early for a16z to claim that the number of NFT buyers was rising, it's probably too early for me to claim it's not — no one should be trying to make broad predictions about market trajectory with this little information, but sadly it's a hallmark of the industry. Still, the April numbers do not appear to support a16z's bullish thesis on NFT user interest.
The State of Crypto Index
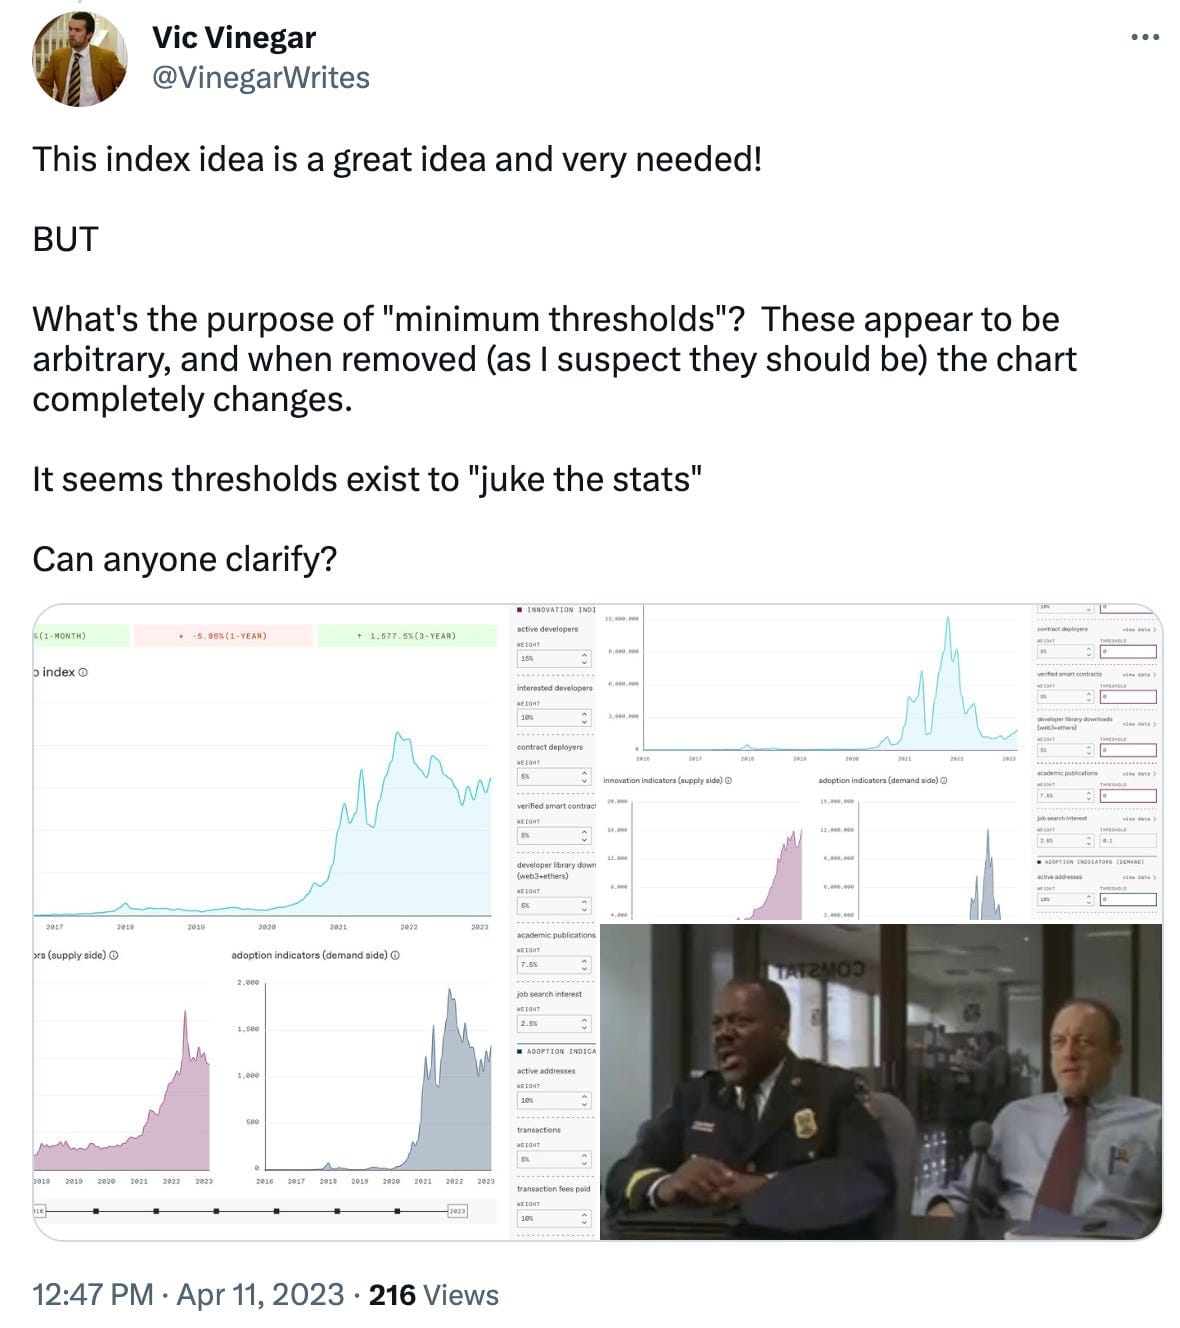
a16z ends the slide deck by introducing their new "State of Crypto" index. Although on the "web3 with a16z crypto" podcast discussing this report, a16z spokespeople try to underscore that people should adjust weights and include or omit data to form their own conclusions about the industry, people are limited to only the questionable datasets that a16z has decided reflect sentiment about the industry.
The index itself is an interactive site that displays at the top a group of charts. At the top we get an exciting claim: "↑ 1,151.62% (3-year)". The convenient thing about arbitrarily defining an index is that a16z can create huge numbers out of thin air!
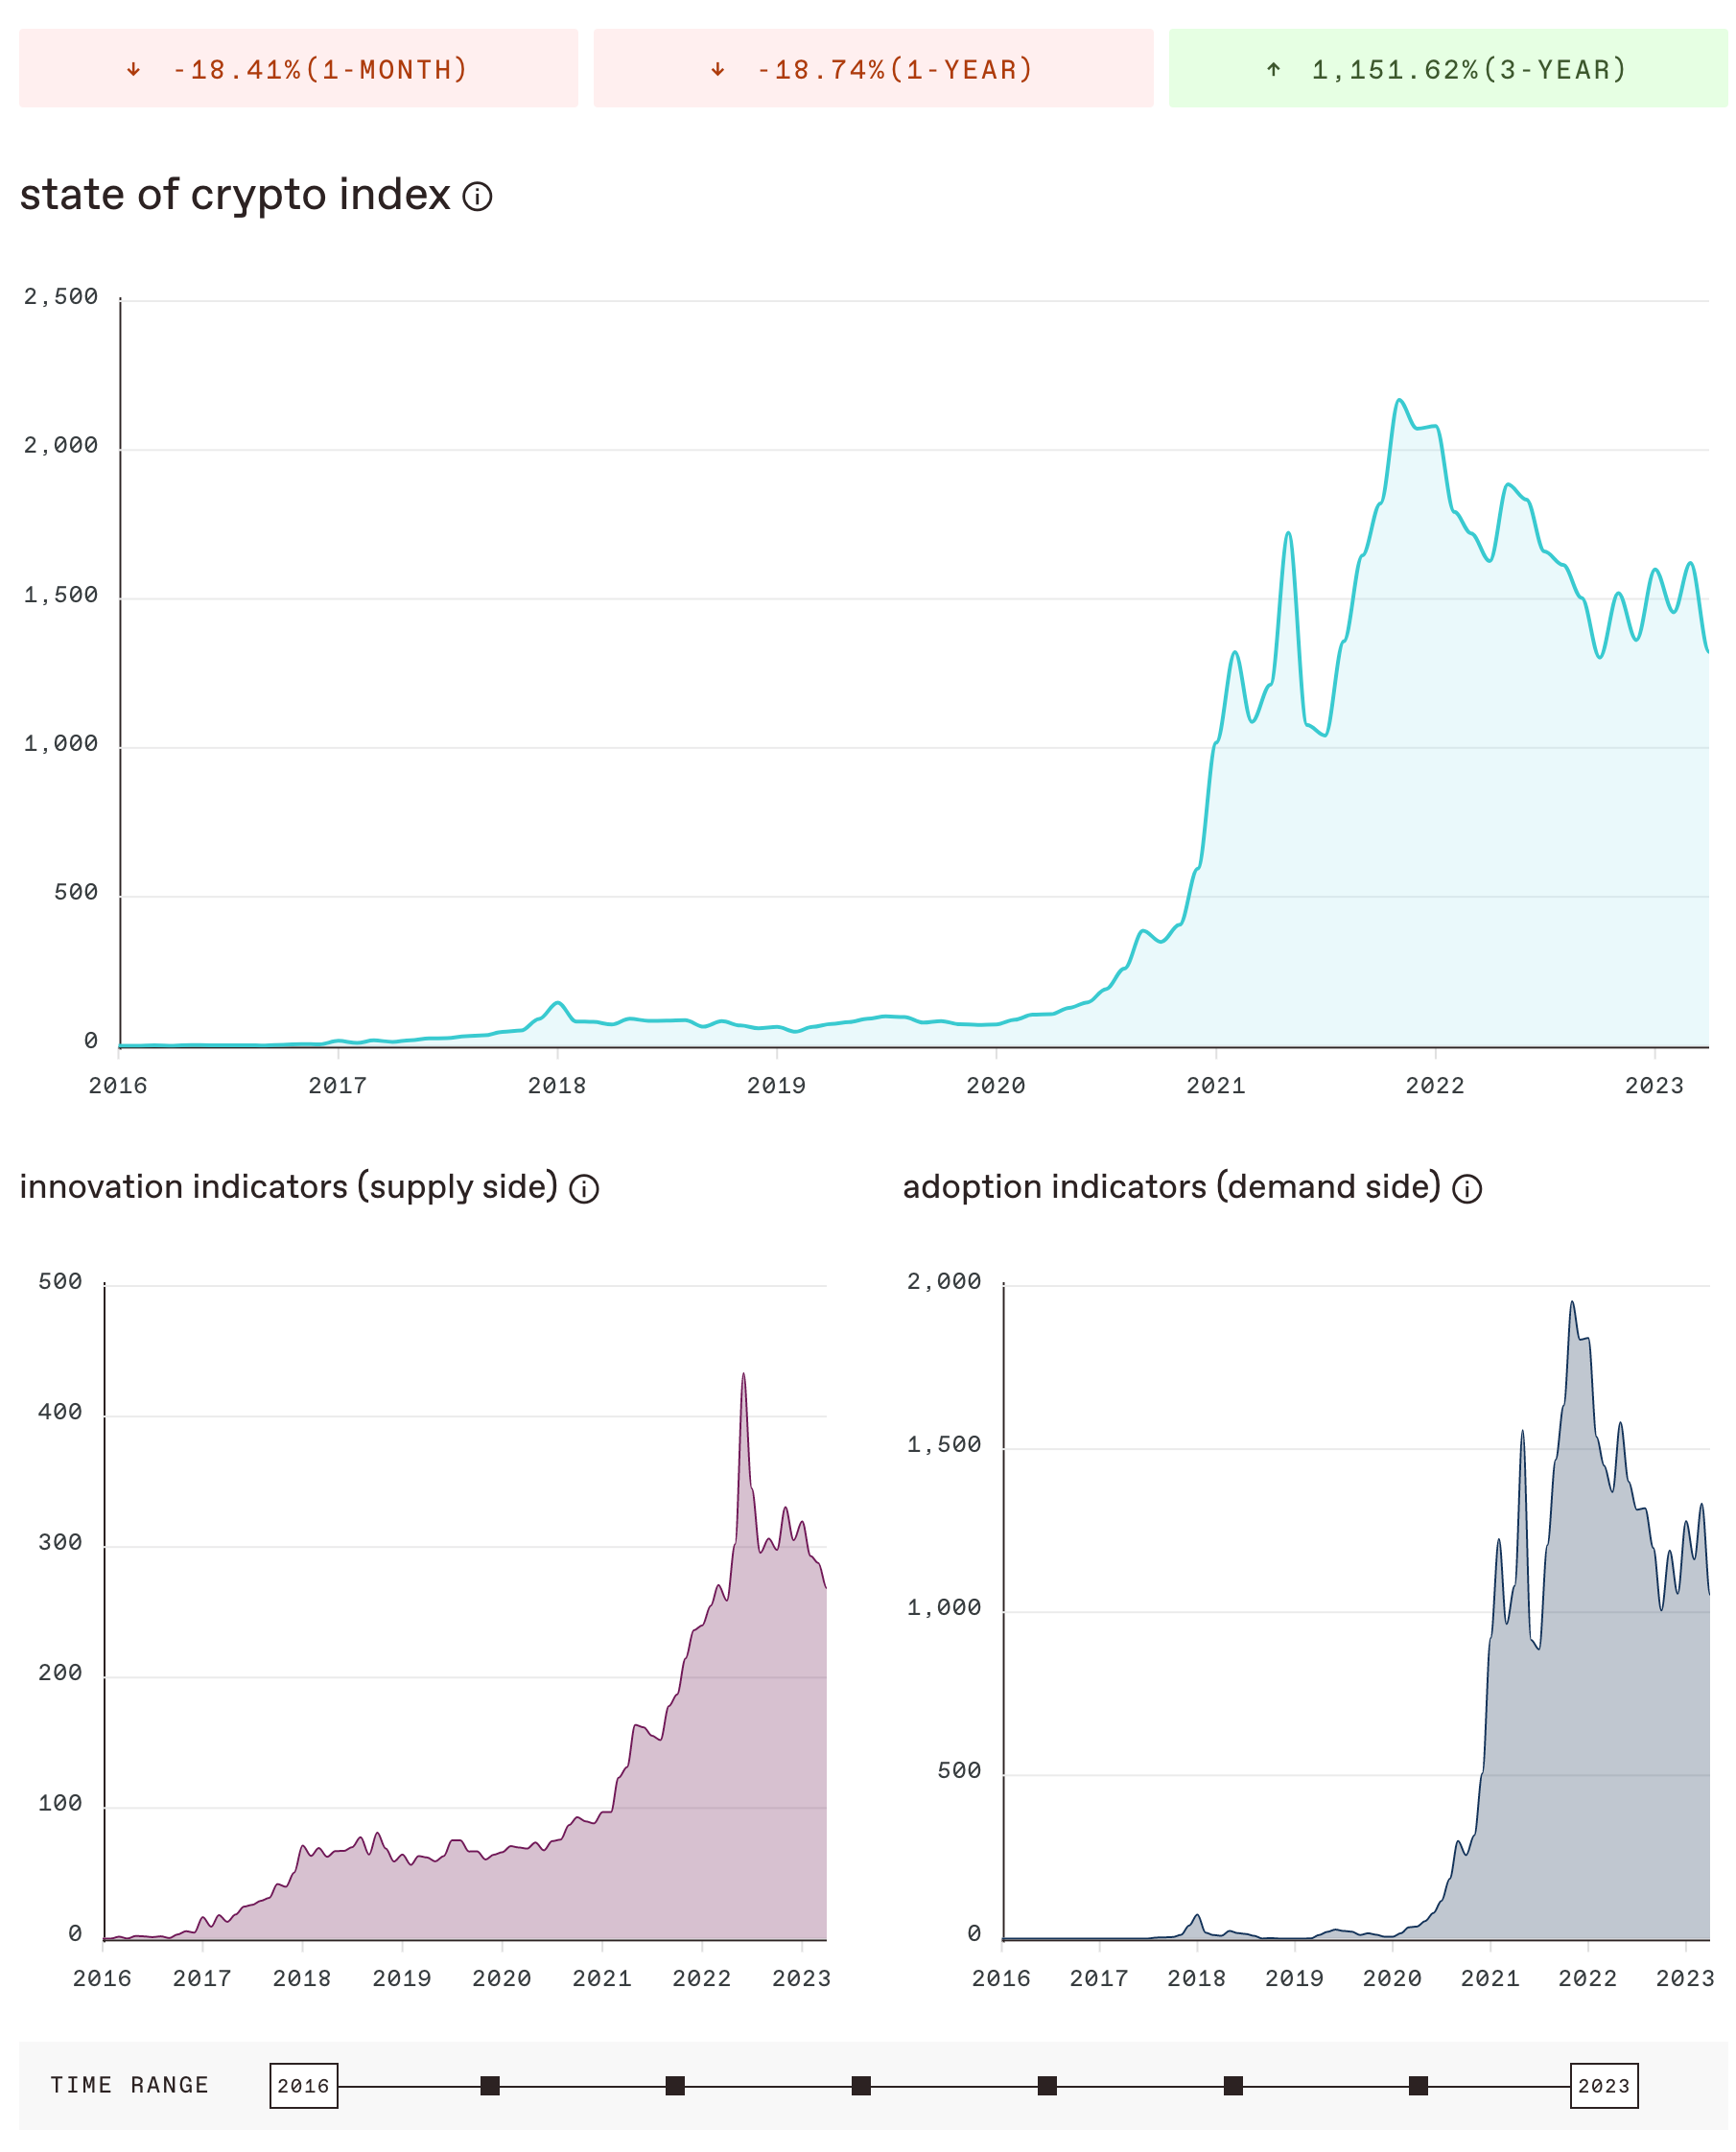
Amusingly, the live version of the index (above) looks depressing compared to the March 31 snapshot captured in the slide deck. I guess it's hard to pick metrics that look good in the moment and forever into the future:
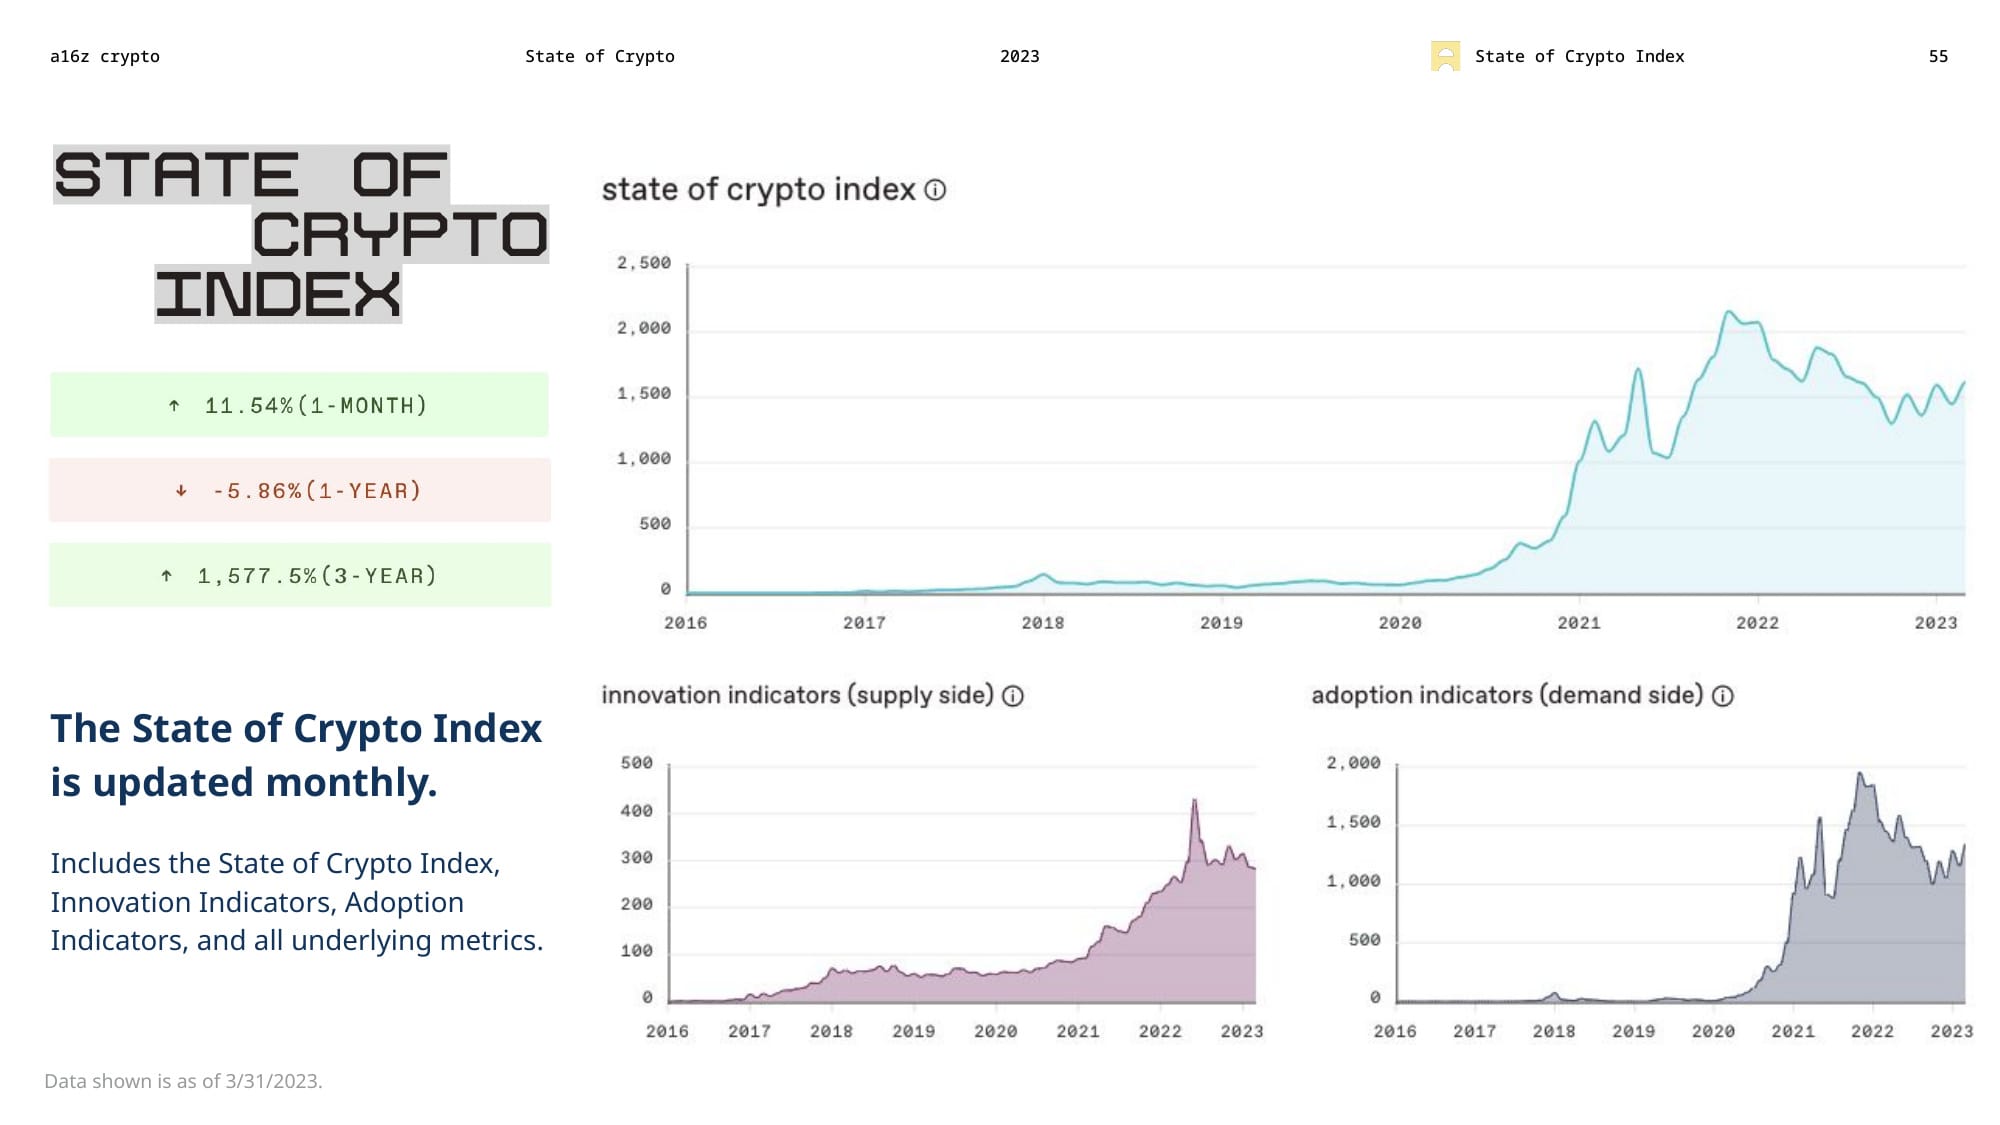
If the index's decline continues, I can't wait to see what new new metrics we will get next year to tell us that crypto is still the future and we're all risking missing out.
The live State of Crypto Index invites visitors to "adjust the weights and thresholds below to form your own view," though visitors are of course limited only to the select datasets that a16z has chosen, which largely show upwards trends with fairly minimal dropoff despite the crypto downturn.
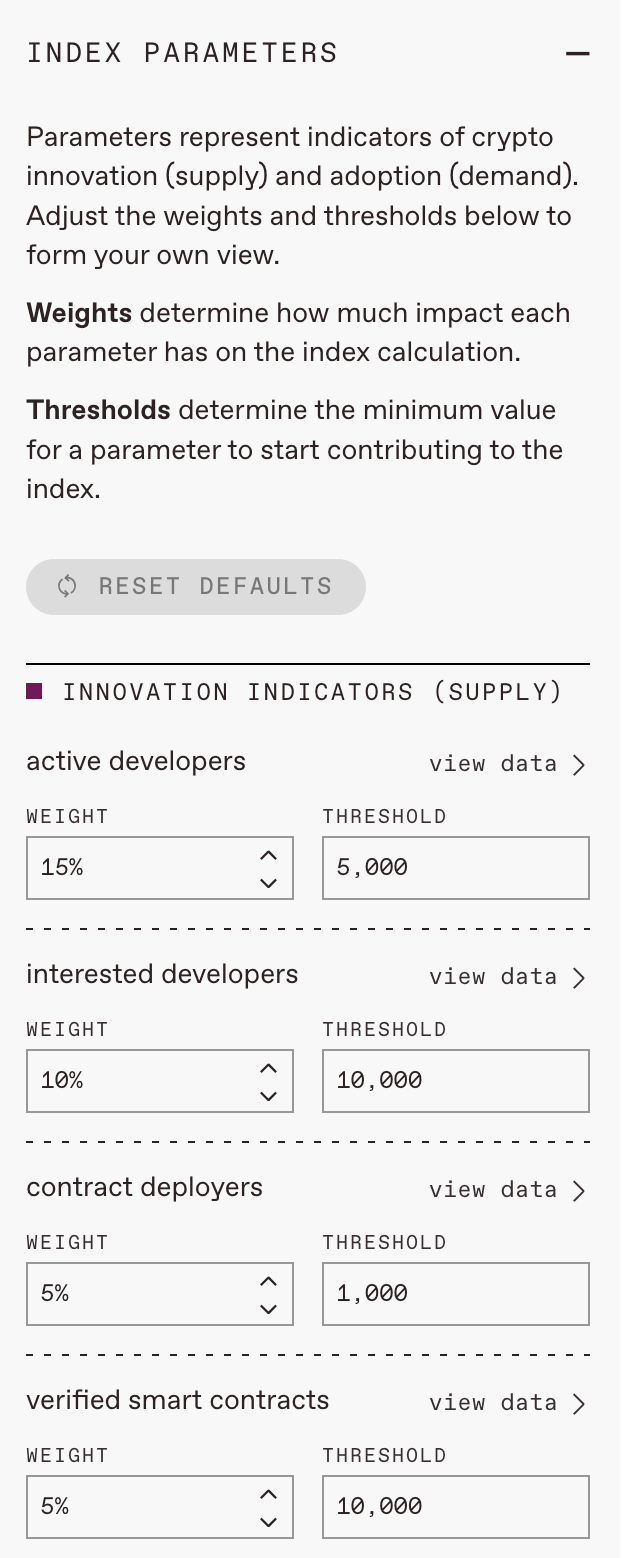
It also includes a "threshold" parameter, whose primary purpose appears to be to prevent some of the metrics from producing a much less rosy chart:
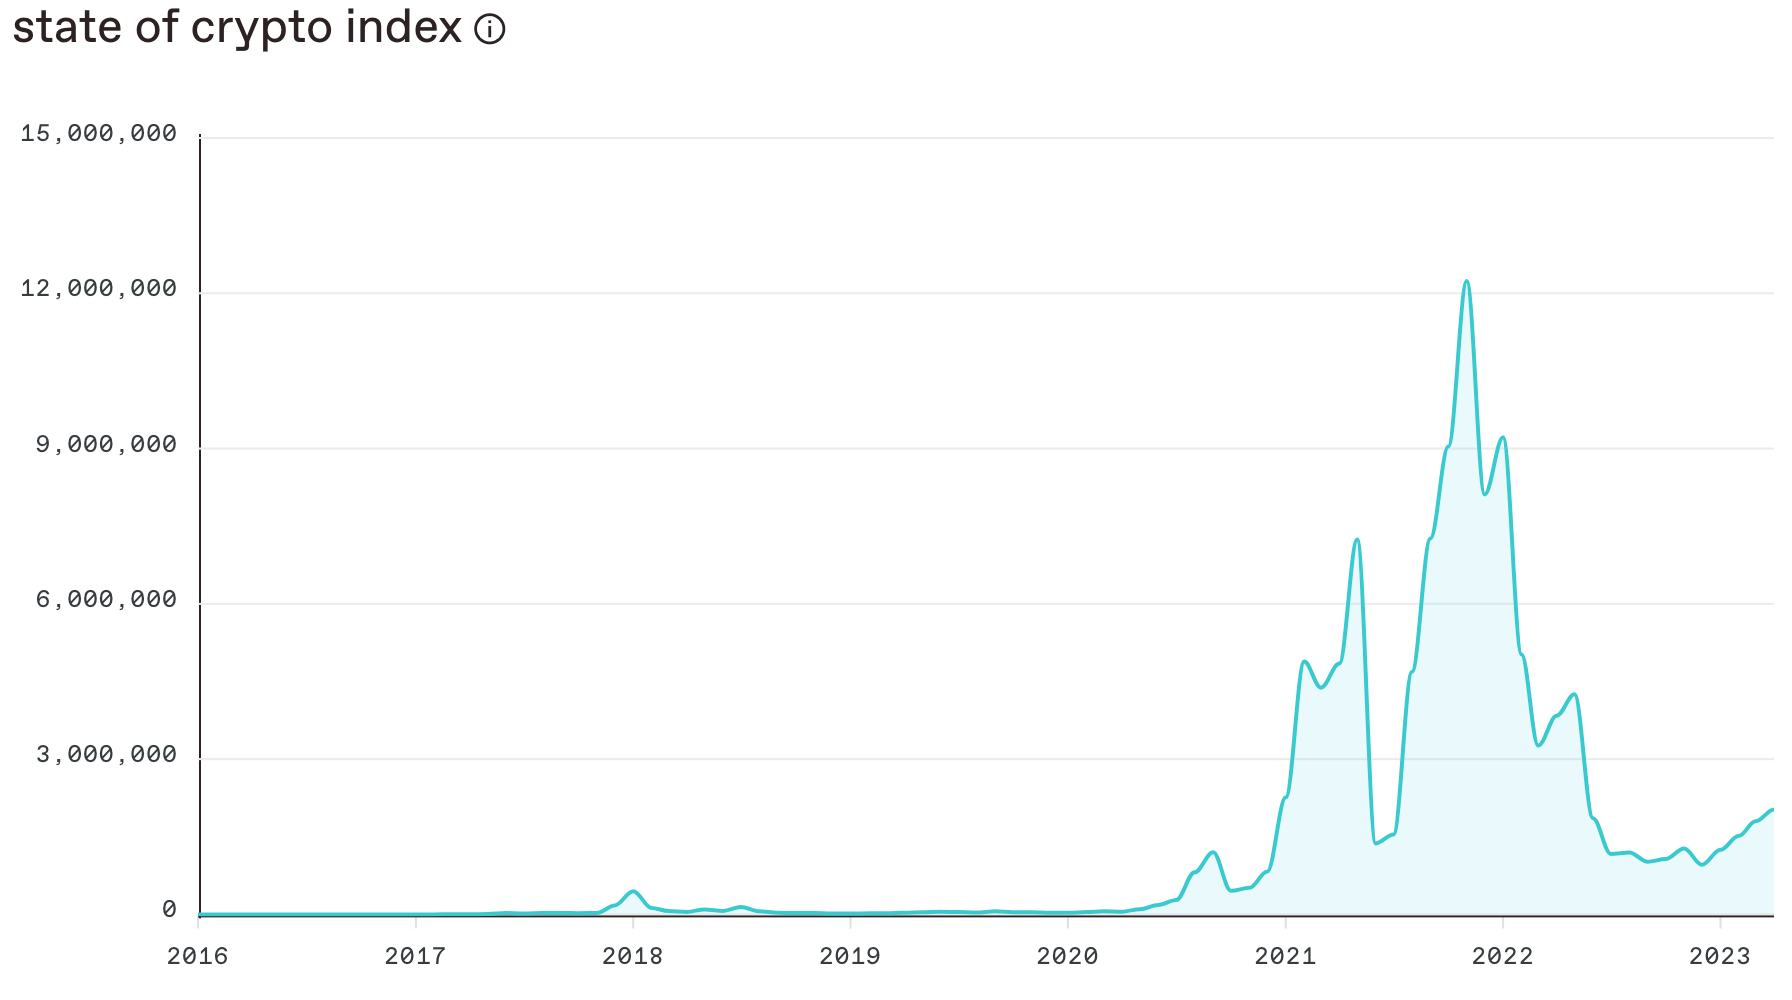
Oof. Ouch.
Even a fan of the index has called out this rather obvious ploy in a response to the Twitter thread announcing it. A16z has not replied as of publication of this article.
The State of Crypto: An exercise in propaganda
If there is one thing that Andreessen Horowitz wants you to take away from their latest State of Crypto report, it's that the crypto industry is still exciting and innovative even though prices have crashed. Their bags are so very heavy, and they need new greater fools onto whom they can offload them.
If there is one thing that I want you to take away from this article, it's that venture capital firms and other heavily invested players in the crypto space should not be trusted to give us the facts on the industry they desperately need to promote. They will produce superficially objective-looking reports full of numbers and charts, but a critical reading shows just how blatantly they are manipulating numbers to arrive at the conclusions that fit their narratives. There is no consequence to Andreessen Horowitz for doing it, and certainly if someone tried to hold them accountable for their blatant twisting of the facts, they would just point to their cover-your-ass disclosures slide in which they disclaim everything in the report.
Reports like this, and other confident narratives spun by the venture capitalists at firms like Andreessen Horowitz, have been enough to fool journalists, legislators, and certainly laypeople in the past. But it's far past time that we see materials like this for what they are, and always have been: blatant propaganda with the sole goal of bolstering the venture capitalist's bottom line.
Footnotes
References
Jin, Berber. "Andreessen Horowitz Went All In on Crypto at the Worst Possible Time". Wall Street Journal. October 26, 2022. ↩
Dixon, Chris. "Why web3 matters". Andreessen Horowitz. September 26, 2021. ↩
Patel, Nilay. "Chris Dixon thinks web3 is the future of the internet — is it?" The Verge. April 12, 2022. (Audio podcast and text transcript). ↩
Kelly, Jemima and Thornhill, John. "A sceptic's guide to crypto: bonus interview with a16z's Chris Dixon". Financial Times. August 23, 2022. ↩
Bitcoin price from January 1, 2022 to May 9, 2023. Coinbase. ↩
No-coners are people who don't trade cryptocurrencies. See: Sharma, Ruchira. "What's a 'Nocoiner'? Inside the World of Crypto Sceptics". Vice. March 16, 2022. Also see: my disclosures. ↩
"About fees for sales on Facebook and Instagram Shops Checkout". Facebook. ↩
Sato, Mia. "Facebook and Instagram won't take a cut from creators' revenues until 2024". The Verge. June 21, 2022. ↩
"About Revue by Twitter". Twitter. ↩
Morehouse, Isaac. "Twetch: A glimpse of the future of social media?" Twetch blog. December 13, 2022. ↩
Their website suggests they only take fees out of client payments, but a Forbes article suggests they take a 25% fee from the freelancers. Perhaps they removed the fee? ↩
For some reason, Toptal isn't listed on a16z's website, but they got a $1.4 million seed round from a16z per TechCrunch. ↩
"The ever-growing developer community". Github. 2022. ↩
Marlow, Fraser; Luo, Yuhan; and Glassco, Alana. "Tracking the Fake GitHub Star Black Market with Dagster, dbt and BigQuery". Dagster. March 16, 2023. ↩
"Bitcoin Energy Consumption Index". Digiconomist. ↩
"State of Crypto: trends, data, more". web3 with a16z crypto. Andreessen Horowitz. April 16, 2023. ↩
"Google Environmental Report 2022". Google. 2022. ↩
"State of Crypto 2022". Page 40. Andreessen Horowitz. May 17, 2022. ↩
Budverse Live Scoreboard NFT activity. OpenSea. ↩
Budverse Cans — Heritage Edition. OpenSea. ↩
Simpson, Arianna. "Investing in Axie Infinity". A16z Crypto. October 5, 2021. ↩
Levine, Matt. "The SEC is Coming for Coinbase". Money Stuff. Bloomberg. March 23, 2023. ↩
"State of Crypto 2023". Pages 44–46. Andreessen Horowitz. April 11, 2023. ↩


